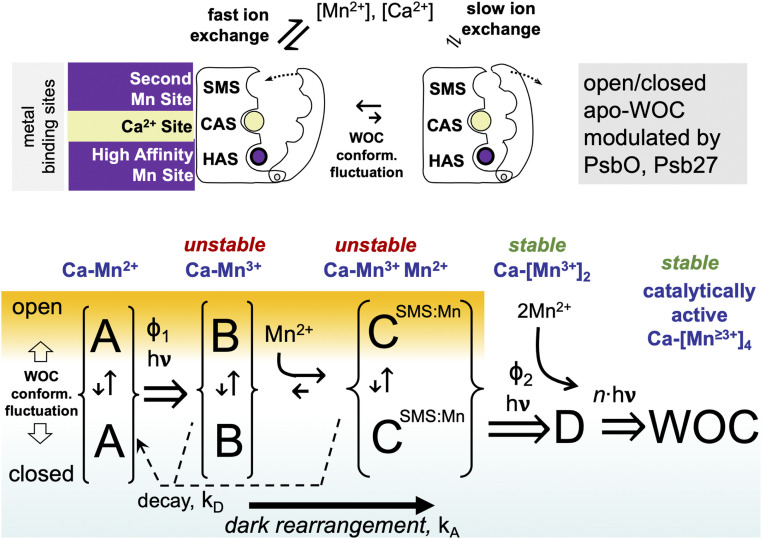
Fig. 6.
Schematic model of the three main metal-binding sites discussed and a minimal model of photoactivation with proposed conformational change and ion exchange accounting for the results. Brackets around individual states A, B, and C indicate alternate protein conformations with similar bound ion states (blue text in figure). Dark decay (kD) of states B and C to A indicated with arrows with dotted lines. Dark rearrangement (B➞C, solid arrow below) is proposed to include ion binding and conformational changes of the CP43 e-loop and D1-carboxyterminal domain. Only the productive pathway involving binding of Mn2+ to the SMS indicated by CSMS:Mn during dark rearrangement is shown, but the not the nonproductive Ca2+ binding at the SMS (SI Appendix, Fig. S1).

