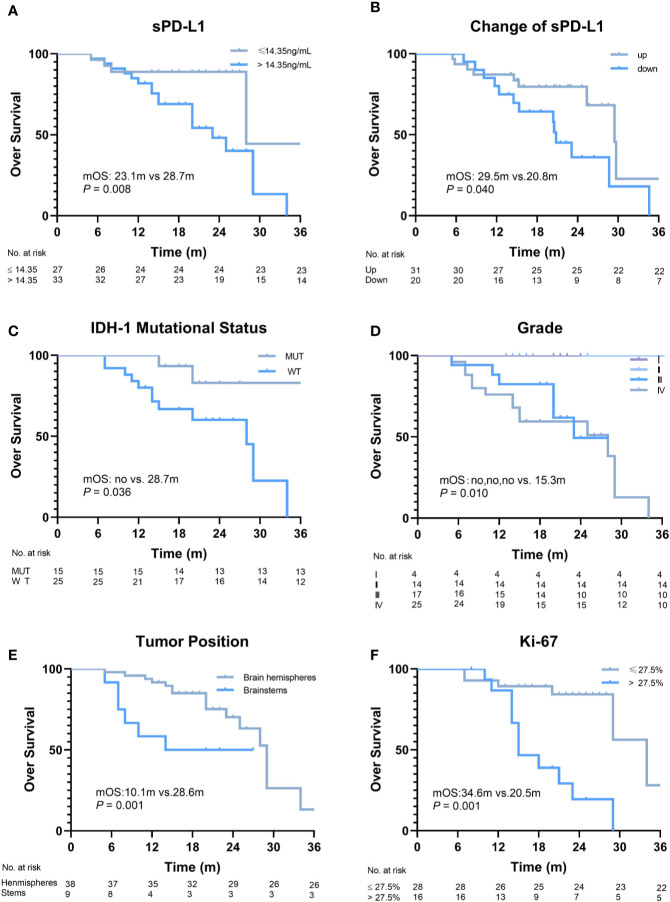
Figure 2.
Overall survival (OS) of patients according to different factors. (A) The baseline level of soluble PD-L1 1 (sPD-L1) (≤14.35 ng/ml vs. >14.35 ng/ml, P = 0.008). (B) Changes in sPD-L1 after radiotherapy (up vs. down, P = 0.04). (C) IDH-1 mutational status (mutation vs. wide type, P = 0.036). (D) Grade (I, II, III, vs. IV, P = 0.01). (E) Tumor position (brain hemispheres vs. brainstems, P = 0.001). (F) Ki-67 (≤27.5% vs. >27.5%, P = 0.001).

