Fig. 3.
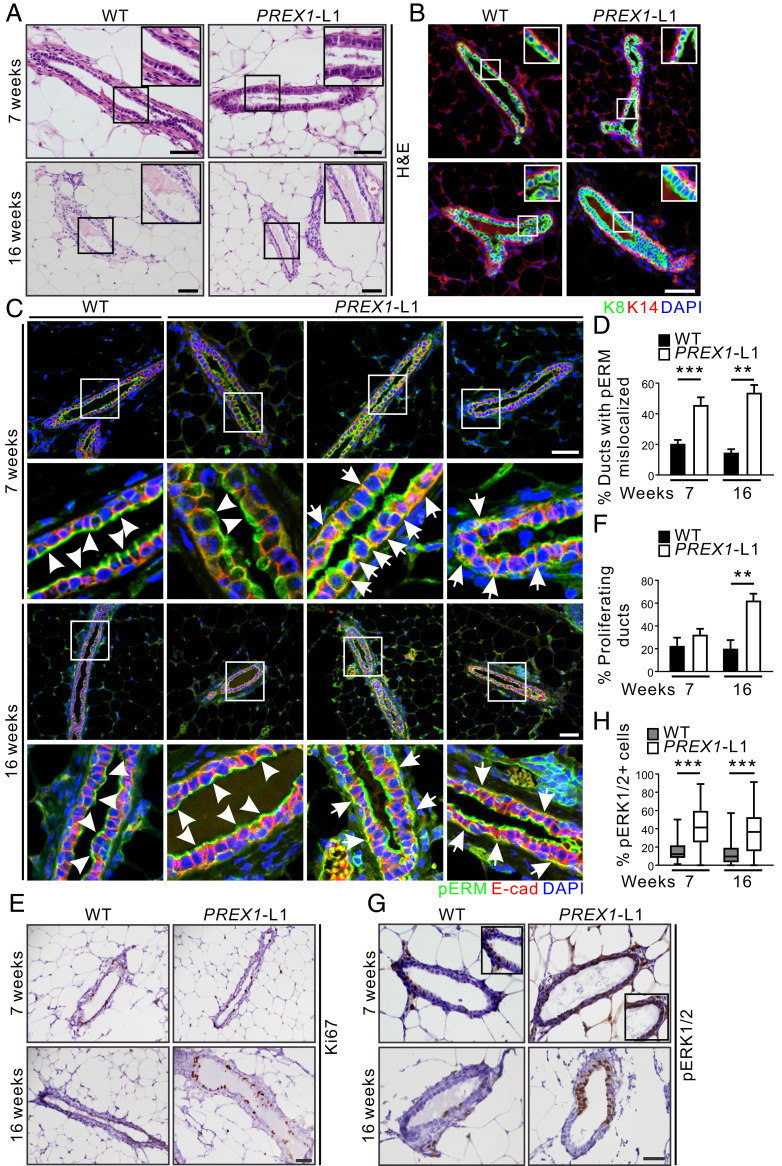
P-Rex1 overexpression disrupts mammary epithelial cell polarity. (A) Formalin-fixed, paraffin-embedded (FFPE) sections of mammary glands from 7- and 16-wk-old WT and MMTV-PREX1L1 mice stained with H&E. (B) FFPE sections of mammary glands from 7- and 16-wk-old WT and MMTV-PREX1L1 mice immunostained with K8 (luminal marker) and K14 (basal marker) antibodies and DAPI. (C and D) FFPE sections of mammary glands from 7- and 16-wk-old WT and MMTV-PREX1L1 mice were immunostained with pERM and E-cadherin antibodies and DAPI. Higher power images of the boxed regions are shown (Lower). Representative images show normal (white arrowheads) and mislocalized (white arrows) pERM staining in mammary ducts (C). Data represent the mean percentage of ducts with mislocalized pERM ± SEM (7 wk: WT n = 7, MMTV-PREX1L1 n = 7; 16 wk: n = 4 mice/genotype, >100 ducts/mouse; one-way ANOVA and Tukey’s multiple comparisons test) (D). (E and F) FFPE sections of mammary glands from 7- and 16-wk-old WT and MMTV-PREX1L1 mice were stained with a Ki67 antibody (E). Data represent mean ± SEM (7 wk: WT n = 7 mice, MMTV-PREX1L1 n = 8 mice; 16 wk: WT n = 5 mice, MMTV-PREX1L1 n = 4 mice, >15 ducts/mouse; one-way ANOVA and Tukey’s multiple comparisons test) (F). (G and H) FFPE sections of mammary glands from 7- and 16-wk-old WT and MMTV-PREX1L1 mice were immunostained with a pERK1/2 antibody (G). Data represent mean percentage of pERK1/2-positive epithelial cells ± SEM (7 wk: n = 3 mice/genotype, 16 wk: n = 5 mice/genotype; >1,500 mammary epithelial cells from four random sections were analyzed per mouse; one-way ANOVA and Tukey’s multiple comparisons test) (H). (Scale bars: 50 μm.) **P < 0.01, ***P < 0.001.

