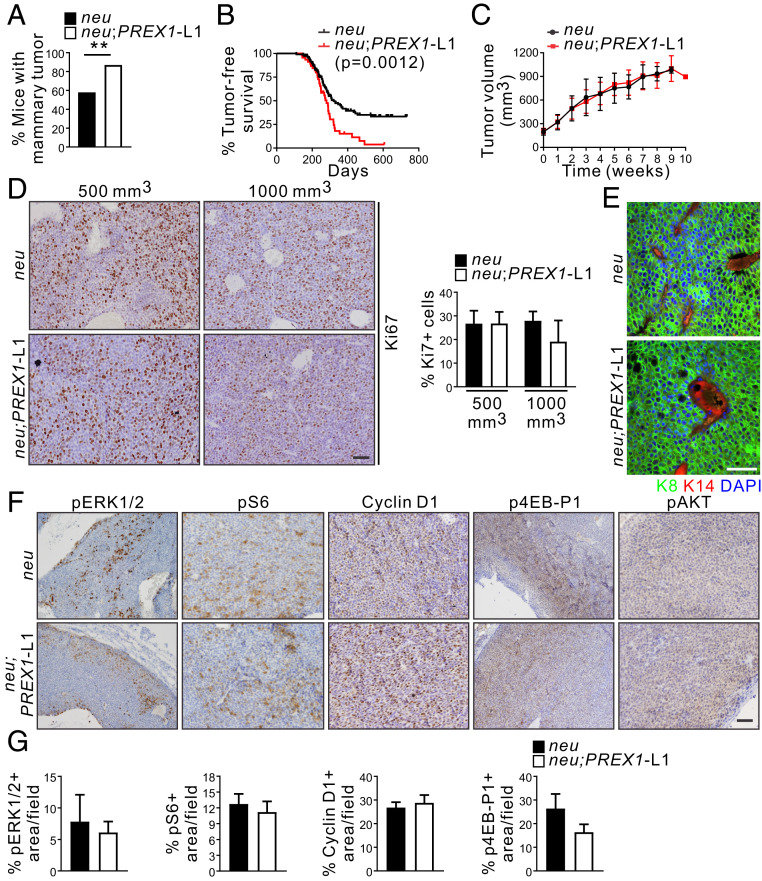
Fig. 5.
P-Rex1 overexpression enhances tumor initiation in an oncogene-driven mouse model of breast cancer. (A) Data show tumor incidence defined as the percentage of MMTV-neu (n = 93) and MMTV-neu;PREX1L1 (n = 38) (χ2 test) mice developing a palpable mammary tumor within the first year of life. (B) Kaplan–Meier curve showing tumor-free MMTV-neu (n = 117) and MMTV-neu;PREX1L1 (n = 46) mice (Log-rank Mantel–Cox test). (C) Data represent mean tumor volume (mm3) ± SEM after diagnosis (time 0) from MMTV-neu (n = 38) and MMTV-neu;PREX1L1 mice (n = 23). The largest tumor in all mice exhibited similar sizes (100 to 200 mm3) at diagnosis. (D) Formalin-fixed, paraffin-embedded (FFPE) sections of 500-mm3 and 1,000-mm3 mammary tumors from MMTV-neu and MMTV-neu;PREX1L1 mice were immunostained with Ki67 antibodies and scored for the presence of Ki67-positive cells. Data represent mean ± SEM (MMTV-neu n = 3, MMTV-neu;PREX1L1 n = 4 mice, >10,000 cells/mouse; one-way ANOVA and Tukey’s multiple comparisons test). (E) Mammary tumoroids from MMTV-neu and MMTV-neu;PREX1L1 transgenic mice immunostained with K8 and K14 antibodies and DAPI. (F and G) FFPE sections of 500-mm3 mammary tumors from MMTV-neu and MMTV-neu;PREX1L1 mice immunostained with pERK1/2, pS6, cyclin D1, p4EB-P1, or pAKT antibodies (F). Data represent the mean percentage of positive area/field ± SEM (>10,000 cells/mouse) (G). (Scale bars: 50 μm in D–F.) **P < 0.01.

