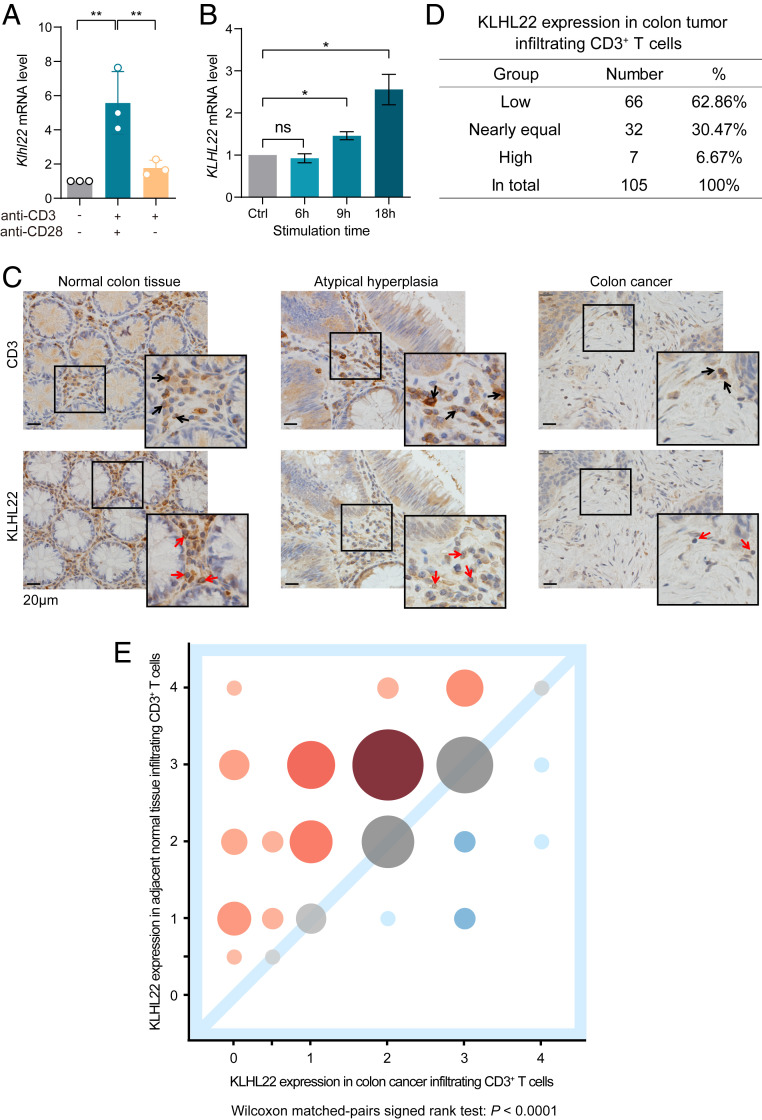
Fig. 6.
T cell activation and the tumor microenvironment regulate KLHL22 expression. (A) The transcription levels of Klhl22 in mouse CD3+ T cells increase dramatically upon T cell activation. CD3+ T cells were isolated from the lymph nodes of C57BL6 WT mice and stimulated with anti-CD3 (2 µg/mL) and/or anti-CD28 (4 µg/mL); the cells were then subjected to total RNA extraction and qRT-PCR analysis. n = 3 independent biological samples per group, **P < 0.01, unpaired Student’s t test. (B) The transcription levels of KLHL22 increase over time in activated Jurkat cells. Jurkat cells were stimulated with PMA (50 µg/mL) and ionomycin (1 µM) for the indicated time and then subjected to total RNA extraction and qRT-PCR analysis. n = 3 independent biological samples per group; ns, not significant, *P < 0.05, unpaired Student’s t test. (C) The level of KLHL22 protein was markedly decreased in tumor-infiltrating T cells of CRC patients. Immunohistochemical staining of KLHL22 and CD3e was performed using a colorectal tissue microarray of CRC patients. CD3e staining was used to mark CD3+ T cells, and KLHL22 staining was used to measure KLHL22 expression in CD3+ T cells. Selected samples from the tissue microarrays show KLHL22 expression in CD3+ T cells. Normal colon tissue (Left), atypical hyperplasia (Center), and colon cancer (Right). The number of atypical hyperplasia samples was too low to be included in the subsequent analyses. The 2× magnified image is displayed in the lower right corner. (Scale bar, 20 μm.) (D) Semiquantitative analysis of KLHL22 levels in CRC patients’ CD3+ T cells. Correlation analyses of KLHL22 expression between tumor-infiltrating CD3+ T cells and CD3+ T cells that infiltrated normal adjacent tissues. (E) Bubble chart showing the individual quantities of samples at different levels. Samples with low KLHL22 expression in tumor-infiltrating T cells are in the upper left quadrant of the graph, represented by red bubbles. Samples with high KLHL22 expression in tumor-infiltrating T cells are in the lower right quadrant of the graph, represented by blue bubbles. Larger bubbles indicate a larger number of samples; smaller bubbles are paler in color. Wilcoxon matched-pairs signed rank test: P < 0.0001.

