Fig. 6.
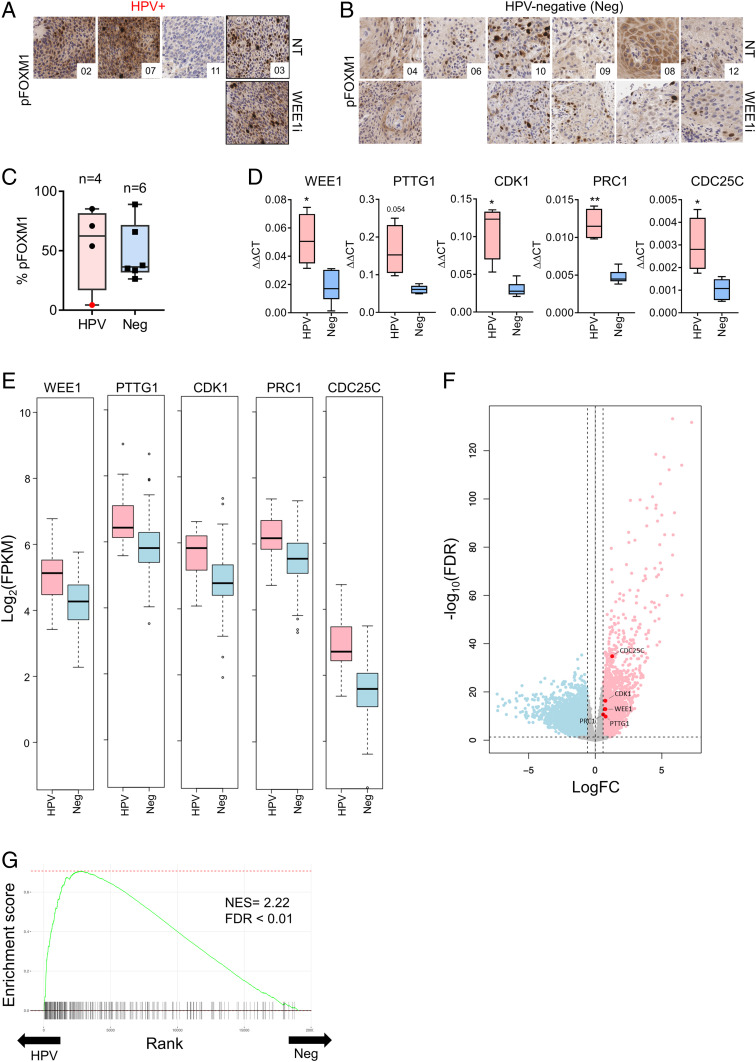
Aberrant FOXM1 activation in HPV+ vs. HPV-negative HNSCCs. (A) pFOXM1 immunohistochemical (IHC) staining in pre-WEE1i and post-WEE1i treatment tumor biopsies from WEE1i phase I clinical trial of HPV+ patients (40×). (B) Staining as in A for HPV-negative (Neg) patients at 40×. (C) Quantification of % positive pFOXM1 nuclear areas in pretreatment biopsies from A and B. Patient 11 (with PIK3CA and AKT mutations) shown in red. (D) Gene expression analysis of representative FOXM1 target genes using a custom RT2 Profiler qPCR array of tumor biopsies from the phase I trial (17). (E) Analysis of FOXM1 target genes expression in HPV+ vs. HPV-negative HNSC tumors from TCGA. HNSC TCGA RNA-seq data are represented as log2 of fragments per kilobase of transcript per million mapped reads from RNA-seq analysis. (F) A volcano plot showing up-regulated (red; n = 2,037) and down-regulated (blue; n = 2,218) genes in HPV+ HNSCC tumors relative to HPV-negative tumors (FDR < 0.05 and 1.5× fold-change) in the HNSC TCGA cohort. (G) Fast gene set enrichment analysis (fgsea) showing the enrichment of FOXM1-target genes among HPV+ HNSCC transcriptomes of the HNSC TCGA cohort. The FOXM1 gene signature (FISCHER_FOXM1) had the second highest normalized enrichment score of all of the gene sets tested (NES = 2.22, FDR < 0.01) in the HNSC TCGA cohort. *P < 0.05, **P < 0.01. NES, normalized enrichment score; FDR, false discovery rate.

