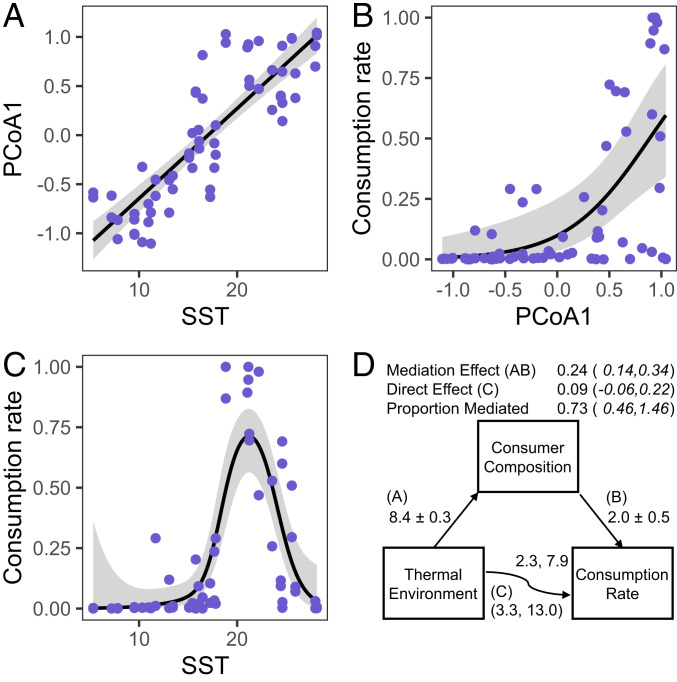
Fig. 3.
Predator composition mediates the effect of thermal environment on consumption rates. (A–C) Bivariate relationships between consumer composition (PCoA1, Fig. 2A), thermal environment (SST), and consumption rate. Lines show predictions from models used in mediation analysis (A, linear regression; B, logistic regression; C, generalized additive modeling). (D) Paths represent causal hypotheses about relationships. Numbers next to paths leading to and from consumer composition are standardized regression coefficients and SEs. Numbers above and below the path from thermal environment to consumption rate are estimated degrees of freedom and χ2 values for the smooth term in the presence and absence of mediation, respectively. Numbers above the path diagram are estimates of the direct and indirect (mediation) effects with 95% bootstrapped CIs.

