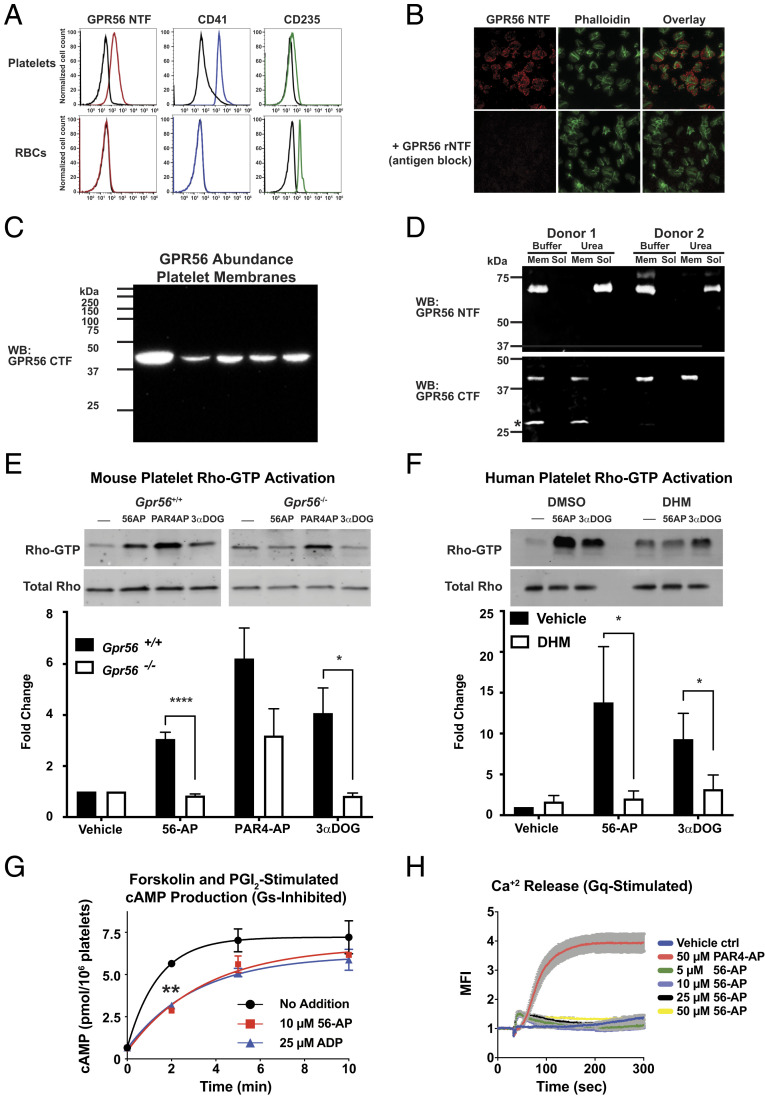
Fig. 2.
GPR56 is platelet GPCR that stimulates Rho-GTP production and inhibits cAMP production. (A) The GPR56 NTF is present on the surface of human platelets but not RBCs as measured by flow cytometry. Platelets were costained with the platelet marker CD41 or the RBC marker CD235. Representative histogram data from SI Appendix, Fig. S2 are shown. (B) Intact human platelets were treated with PAR4-AP and adhered and spread on vitronectin-coated glass for 30 min. The intact platelets were costained with the GPR56 NTF antibody (red) and FITC-phalloidin (green) with or without antibody blocking using purified GPR56 rNTF. (C) Platelet membranes (20 µg) prepared from five human donors were quantitatively immunoblotted with the GPR56 CTF antisera. (D) Platelet membrane GPR56 is predominantly self-cleaved. Two human platelet membrane preparations were mock treated (PBS) or urea treated, and the membrane and solubilized material were immunoblotted for the presence of the GPR56 NTF and CTF. The GPR56 CTF retains membrane association, whereas the NTF was solubilized with urea. *Denotes an alternative SDS/PAGE form of the GPR56 CTF (23). (E) Wild-type or Gpr56−/− mouse platelet Rho activation stimulated by 56-AP agonist peptide or 3-α-DOG. Relative total Rho and Rho-GTP levels were quantified by pixel densitometry. Error bars are the mean ± SEM: wild type, n = 4; Gpr56−/−, n = 3. One-way ANOVA. *P ≤ 0.01; ****P ≤ 0.0001. (F) Human platelet Rho activation stimulated by 56-AP agonist peptide or 3-α-DOG, with or without DHM inhibition. Relative total Rho and Rho-GTP levels were quantified by pixel densitometry. Error bars are the mean ± SEM: human, n = 4. One-way ANOVA. *P ≤ 0.01. (G) Forskolin and PGI2 costimulation of cAMP accumulation in human platelets is inhibited by 56-AP agonist peptide (10 μM) or the purinergic agonist, ADP (25 µM). Error bars are the mean ± SEM (n = 4). One-way ANOVA. **P ≤ 0.01. (H) GPR56 activation does not stimulate Gq-mediated calcium release from intracellular stores. Human platelets were treated with 1 mM probenecid and loaded with Fluo4-AM, prior to stimulation with PAR4-AP (50 μM) or 56-AP (concentration series). Shown are the mean fluorescence intensities (MFIs) of intracellular calcium release. Error is the mean ± SEM: n = 4. Mem, membrane; Sol, soluble; WB, Western blot.

