Fig. 3.
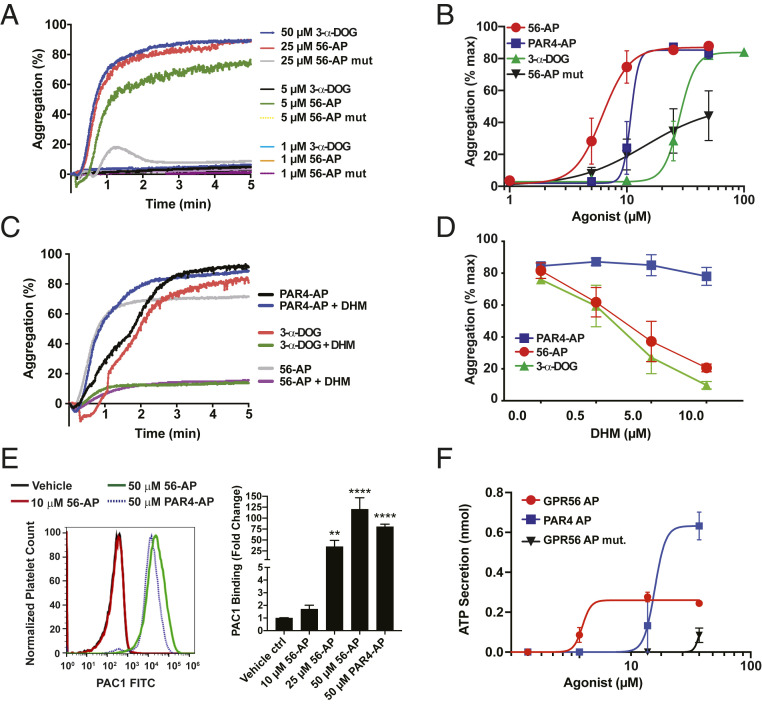
GPR56 activates platelet aggregation and integrin activation. (A) Representative tracings of human platelet aggregation in response GPR56 peptide agonist mimetics (56-AP and 56-AP mutant) and 3-α-DOG. (B) Concentration response curves of human platelet aggregation mediated by 56-AP, 56-AP mutant, PAR4-AP, and 3-α-DOG. Error bars are the mean ± SEM (n = 5). (C) Representative aggregometry tracings of 56-AP–, 3-α-DOG–, and PAR4-AP–induced human platelet aggregation at 80% maximal effective concentration (EC80) with DHM inhibition. (D) Concentration response curves of DHM inhibition of human platelet aggregation induced by GPR56, 3-α-DOG, and PAR4 agonists at EC80. Error bars are the mean ± SEM (n = 5). (E) Flow cytometric analysis of αIIbβ3 integrin activation via PAC-1–FITC staining of human platelets treated with a 56-AP concentration series or a maximal PAR4-AP concentration. Representative mean fluorescent intensity traces of PAC-1–FITC binding to human platelets are shown alongside histograms. Error bars are the mean ± SEM (n = 6). One-way ANOVA. **P ≤ 0.01; ****P ≤ 0.0001. (F) Concentration response relationships of 56-AP, 56-AP mutant, and PAR4-AP toward ATP secretion as measured in a Lumi-aggregometer. Error bars are the mean ± SEM (n = 5).

