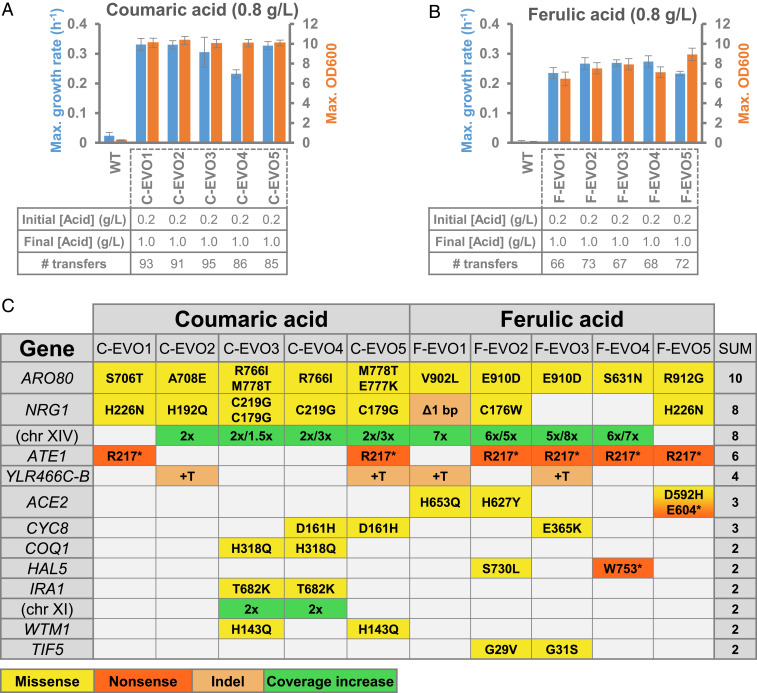
Fig. 1.
Summary of the results from the adaptive laboratory evolution experiments for tolerance to coumaric acid and ferulic acid. Average growth rates (h−1) and maximum optical densities (OD600) achieved by the three best performing mutants isolated from each of the five populations evolved for coumaric acid tolerance (A) and ferulic acid tolerance (B). Error bars represent the SD from the three best mutants (each with three replicates). (C) Table of mutations for genes mutated in more than one population. Information regarding the individual growth rates, maximum optical densities, and lists of all mutations detected can be found in SI Appendix, Tables S1–S4.

