Fig. 3.
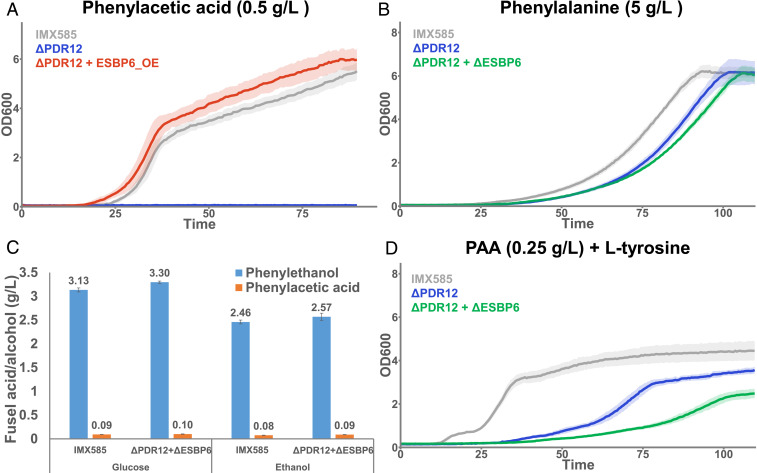
Influence of PDR12/ESBP6 on fusel acid tolerance and AAA metabolism. (A) Growth curves in medium with 0.5 g/L of phenylacetic acid for a reference strain (IMX585) in comparison to a PDR12 deletion mutant (ΔPDR12) and a double mutant lacking PDR12 and displaying the overexpression of ESBP6 (ΔPDR12+ESBP6_OE). Cells were grown in 96-well plates with a volume of 250 μL in medium with 0.5 g/L of phenylacetic acid. (B) Growth curves in medium with 5 g/L of l-phenylalanine as nitrogen source for a reference strain (IMX585) in comparison to a PDR12 deletion mutant (ΔPDR12) and a double deletion mutant lacking PDR12 and ESBP6 (ΔPDR12+ΔESBP6). Cells were grown in 96-well plates with a volume of 250 μL in medium with 5 g/L of l-phenylalanine as nitrogen source and 20 g/L of ethanol as carbon source. (C) Extracellular concentration of phenylacetic acid and phenylethanol in cultures of a reference strain (IMX585) and a double deletion mutant (ΔPDR12+ΔESBP6) grown in medium with 20 g/L of glucose or 10 g/L of ethanol as carbon source. Cells were grown in shake flasks with a volume of 25 mL in medium with the mentioned nitrogen and carbon sources. Error bars represent the SD from three biological replicates. (D) Growth curves in medium with 0.25 g/L of phenylacetic acid and 0.5 g/L of l-tyrosine as the nitrogen source for a reference strain (IMX585) in comparison to a PDR12 deletion mutant (ΔPDR12) and a double deletion mutant lacking PDR12 and ESBP6 (ΔPDR12+ΔESBP6). Cells were grown in 96-well plates with a volume of 250 μL in medium with 0.5 g/L of l-tyrosine as the nitrogen source and 0.25 g/L of phenylacetic acid. All growth curves were performed for three biological replicates (each with two technical replicates) and the average OD600s are shown as solid lines with the interval encompassing the SD represented as a shaded area.

