Fig. 3.
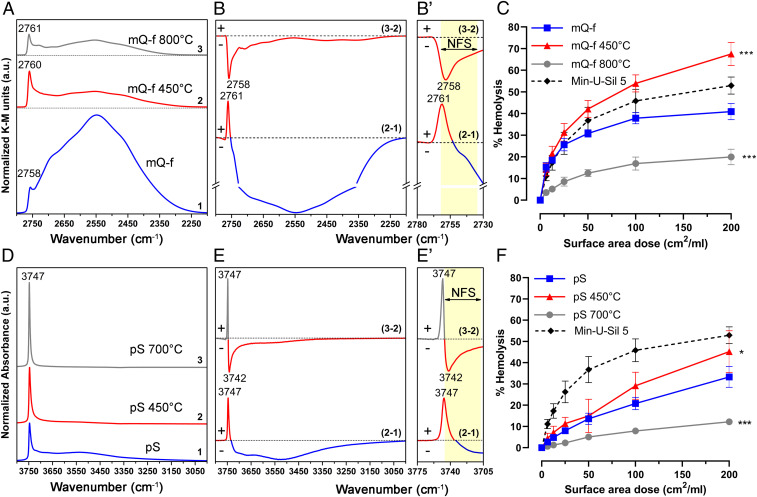
Nearly-free silanols (NFS) determine the membranolytic activity of crystalline and amorphous silica particles. (A–C) Relative variation of NFS determines the membranolytic activity of fractured mineral quartz particles (mQ-f). (A) Surface silanol distribution (after H/D exchange, reflectance IR spectra reported in Kubelka–Munk function) of 1) pristine mQ-f (at room temperature [r.t.]), 2) mQ-f calcined at 450 °C, and 3) mQ-f calcined at 800 °C. (B and B′) Differences in silanol population (between pairs of spectra in A) as a result of thermal treatments: (2−1) calcined at 450 °C – pristine, (3−2) calcined at 800 °C – calcined at 450 °C. (B′) Enlarged section of the difference spectra (B) showing the νOD spectral region of NFS (2,762 to 2,735 cm−1) and isolated silanols. (C) Membranolytic activity (percent hemolysis) of pristine and calcined mQ-f samples, and Min-U-Sil 5 (positive reference particle). (D–F) NFS are present on amorphous pyrogenic silica (pS) and determine its membranolytic activity. (D) Surface silanol distribution (transmittance IR spectra reported in absorbance) of (1) pristine pS, (2) pS calcined at 450 °C, and (3) pS calcined at 700 °C. (E and E′) Differences in silanol population (between pairs of spectra in D) as a result of thermal treatments: (2−1) calcined at 450 °C – pristine; (3−2) calcined at 700 °C – calcined at 450 °C. (E′) Enlarged section of the difference spectra (E) showing the νOH spectral region of NFS (3,746 to 3,708 cm−1) and isolated silanols. Panels D and E are adapted from Rimola et al. (13). (F) Membranolytic activity (percent hemolysis) of pristine and calcined pS samples, and Min-U-Sil 5 (positive reference particle). Data in C and F are mean ± SEM of three independent experiments; P values of calcined samples compared to the pristine ones determined by two-way ANOVA followed by Dunnett’s post hoc test (mean effect): *P = 0.0206; ***P < 0.001.

