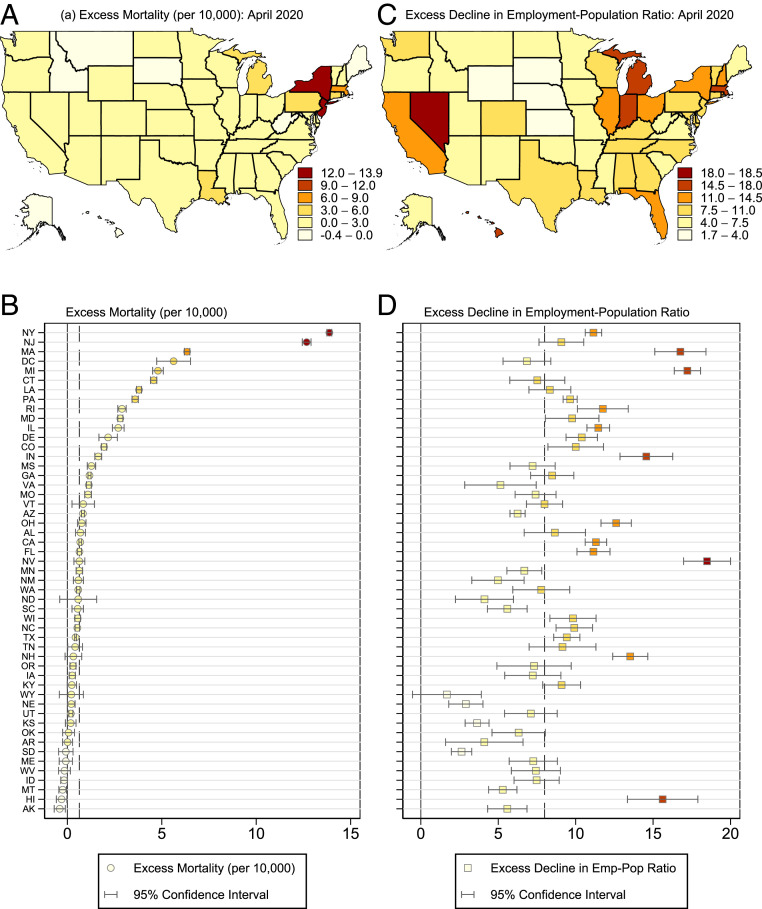
Fig. 2.
Geographic heterogeneity in outcomes by state: April 2020. These figures show deviations from expected (A and C) mortality and (B and D) employment–population ratios within each state in April 2020. For dot plots in C and D, states are ordered in descending order of their excess mortality. Dotted lines show the median of each outcome across states in April 2020. CPS data include all individuals 16 y and older and CDC data include all individuals of any age. Mortality data use CDC weighted death count estimates. Predicted values are calculated using a linear time trend with month fixed effects with preperiod 2011 to 2019. Annual population counts to calculate mortality come from the Census Bureau in each state from 2011 to 2019. Heteroskedasticity-robust SEs to construct 95% confidence intervals are computed with clustering by year.

