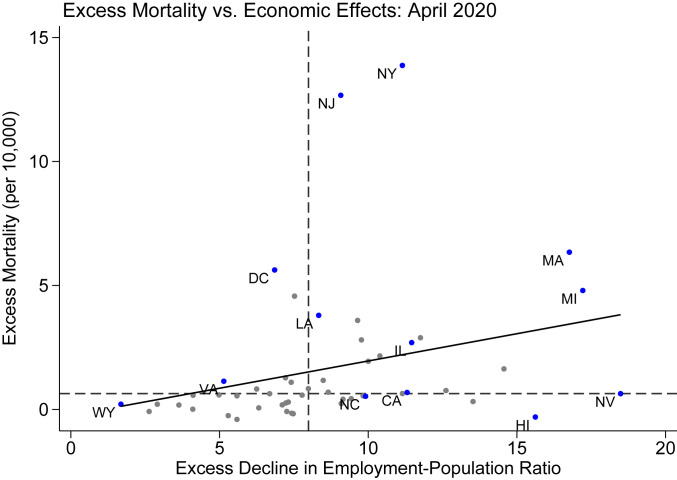
Fig. 3.
Excess mortality and economic damage comparison by state. This figure compares excess mortality and the economic impacts of COVID-19 in April 2020; each point is one state. Economic measures are calculated using the IPUMS CPS microdata and mortality measures are calculated using aggregate CDC data. Excess amounts are calculated by comparing observed values in April 2020 to predicted values. Predicted values are calculated using a linear time trend with month fixed effects; the preperiod is 2011 to 2019. The solid line shows the line of best fit from an unweighted regression. Dashed lines show the median value of excess mortality and the excess decline in employment–population ratio.

