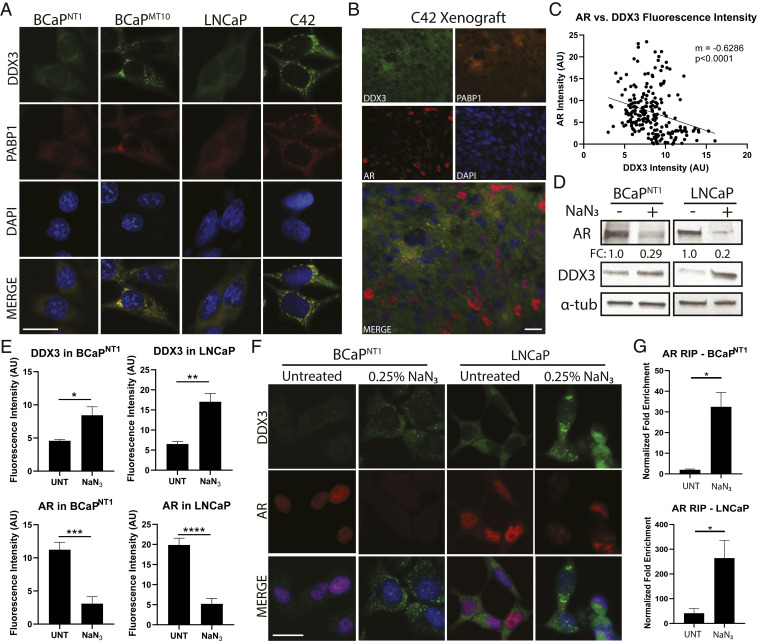
Fig. 3.
DDX3 localizes to SGs in CRPC and represses AR protein expression. Consistent with translational repression, DDX3-mediated regulation of AR occurred when DDX3 was localized to SGs. Induction of SGs resulted in increased AR mRNA bound to DDX3 and decreased AR protein expression. (A) Immunofluorescence for DDX3 (green) showed localization to cytoplasmic puncta (SGs) in CRPC lines BCaPMT10 and C42 grown in vitro, as compared to diffuse cytoplasmic staining in the parental cell lines BCaPNT1 and LNCaP. Merged images show colocalization (yellow) of DDX3 with SG marker PABP1 (red). Nuclei were counterstained with DAPI (blue). (B) IHC of a C42 xenograft grown in vivo showed colocalization of DDX3 (green) and PABP1 (orange) puncta and AR protein expression in red. In these xenografts, DDX3/PABP1 puncta are only present in AR protein negative cells, despite robust AR protein expression in the surrounding area (red nuclei). Nuclei were counterstained with DAPI (blue). (C) Linear regression for DDX3 and AR protein fluorescence intensity in C42 xenografts showed a significant negative correlation between DDX3 and AR expression (n = 3, P < 0.0001). (D) Western blot analysis of AR protein expression in BCaPNT1 and LNCaP bulk populations after induced hypoxic stress by 3 h treatment with 0.25% sodium azide (NaN3) showed a decrease of overall AR protein (FC = 0.29 for BCaPNT1 and 0.2 for LNCaP), with a concurrent increase of DDX3 protein expression. α-tub was used as a loading control. (E) Quantification of DDX3 and AR protein fluorescence intensity after treatment with NaN3 showed a significant increase of DDX3 intensity (P = 0.037 in BCaPNT1 and P = 0.002 in LNCaP) and a significant decrease of AR intensity (P = 0.0001 in BCaPNT1 and P < 0.0001 in LNCaP) compared to UNTs. Fluorescence intensity was averaged between at least three separate experiments. (F) Representative images for hypoxia-induced stress from E showed NaN3 treatment increased DDX3 expression (green) and induced localization to cytoplasmic puncta concurrent with decreased AR protein expression (red) in parental cell lines BCaPNT1 and LNCaP. Nuclei were counterstained with DAPI (blue). (G) RIP analysis following treatment with NaN3 significantly increased AR mRNA bound to DDX3 compared to UNT (BCaPNT1, P = 0.043; LNCaP, P = 0.039). (Scale bars, 10 µm.) Bar graphs represent mean ± SEM. Significance is represented by *P ≤ 0.05, **P ≤ 0.01, ***P ≤ 0.001, ****P ≤ 0.0001.

