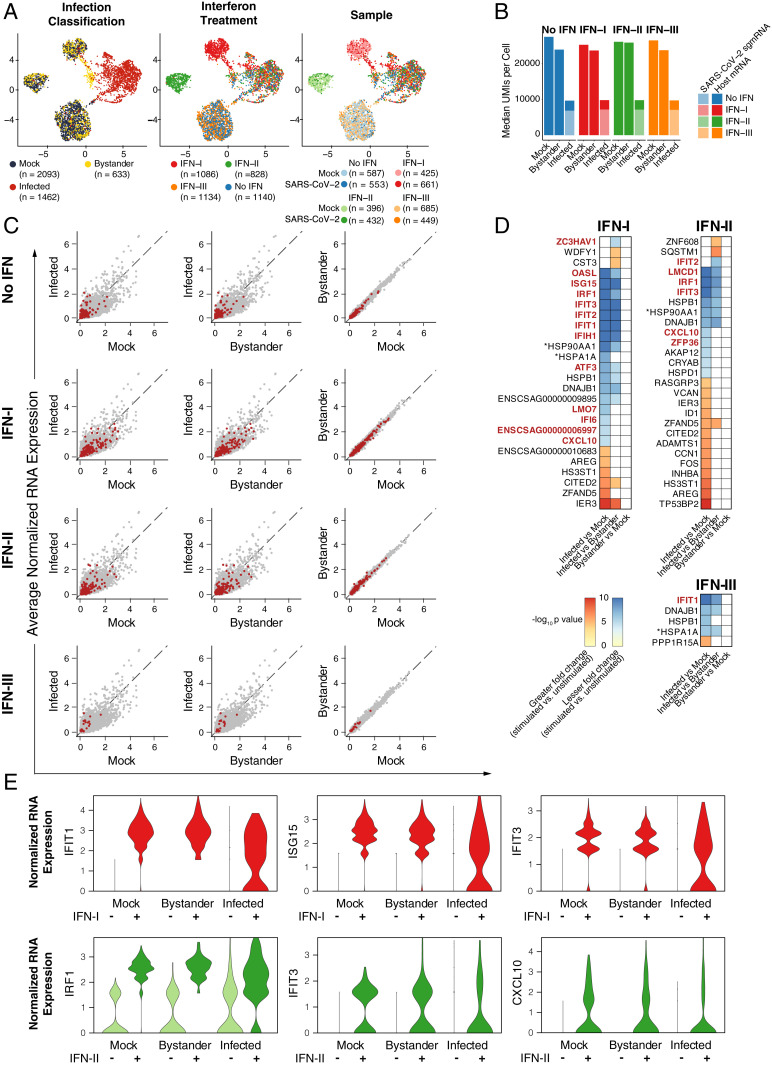
Fig. 4.
scRNA-Seq of SARS-CoV-2 infected, uninfected, and bystander cells. (A) Uniform manifold approximation and projection (UMAP) plots of Vero E6 cells treated with IFN-I, IFN-II, and IFN-III in the presence or absence of SARS-CoV-2. Points are colored by infection status as classified by SARS-CoV-2 sgmRNA expression (Left), IFN treatment (Center), or sample of origin (Right). (B) Median total number of transcript UMIs per cell derived from SARS-CoV-2 or from host genes by infection status and IFN condition. (C) Scatterplots of average normalized gene expression for all expressed genes in indicated conditions. Each row compares infected, mock, or bystander cells within an IFN condition. Red points indicate ISGs from all IFN treatments (Top) or from corresponding IFN treatment (IFN-I, IFN-II, or IFN-III, respectively, from the second row). Normalized expression values were calculated from downsampled transcript count data (to mitigate the effects of different host gene detection rates due to infection status, see Materials and Methods). (D) Genes with significant differential induction (IFN-I, IFN-II, or IFN-III stimulated versus unstimulated) between infection status groups (mock, bystander, and infected). *Gene ID ENSCSAG00000010250 and ENSCSAG00000019310 are labeled HSP90AA1 and HSPA1A, respectively, based on National Center for Biotechnology Information (NCBI)/Ensembl annotations. (E) Normalized expression (downsampled transcript counts) for several ISGs with significant differences in induction between infection status groups.

