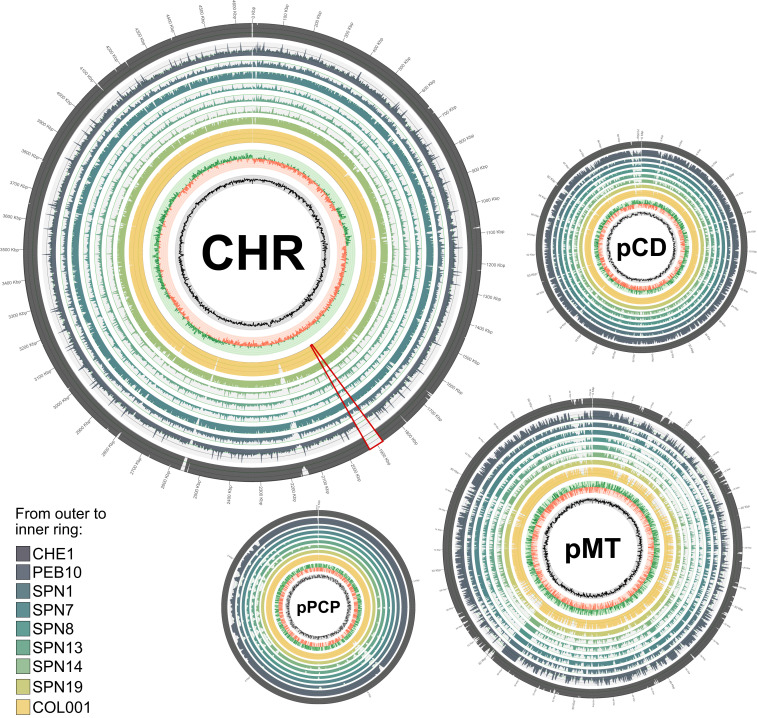
Fig. 1.
Coverage plots for nine genomes to Y. pestis CO92. Plots represent the chromosome and each of the three CO92 plasmids (CHR: chromosome). Rings (from outer to inner ring) show coverage (rings 1 to 9), GC skew (ring 10), and GC content (ring 11, range: 30 to 70%). aDNA genomes are ordered as follows (from outer to inner ring): CHE1, PEB10, SPN1, SPN7, SPN8, SPN13, SPN14, SPN19, and COL001. Coverage cutoff for PEB10, CHE1, and COL001 is 15× and 5× for all SPN samples. Plots were created with Circos (73). The chromosomal plots were calculated in 2,000-bp windows, the plots for pMT and pPCP in 50-bp windows, and the plot for pCD in 10-bp windows. The 49-kbp deletion is marked in red on the chromosomal plot.

