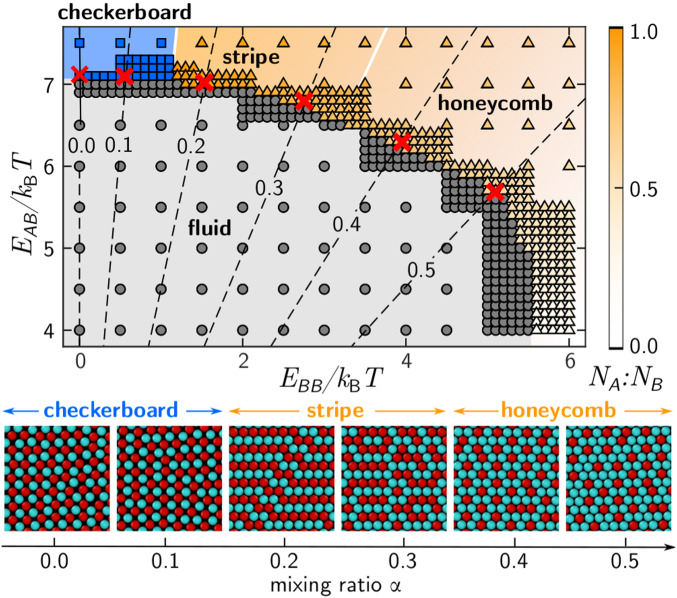
Fig. 3.
Simulated phase diagram as a function of “like” and “unlike” pair interactions. Each point corresponds to one simulation: Circles show the fluid phase; squares show the crystal phases with square symmetry; and triangles show the crystal phases with hexagonal symmetry. Hexagonal phases are classified by using stoichiometry (color map). Stripe composition: = 1:1; and honeycomb composition: 1:2. White lines show boundaries between checkerboard, stripe, and honeycomb compositions. Black dashed lines show model predictions of binding strengths as a function of temperature for different mixing ratios . Red crosses correspond to the approximate conditions used in experiments. Snapshots show simulated crystal phases corresponding to red crosses.

