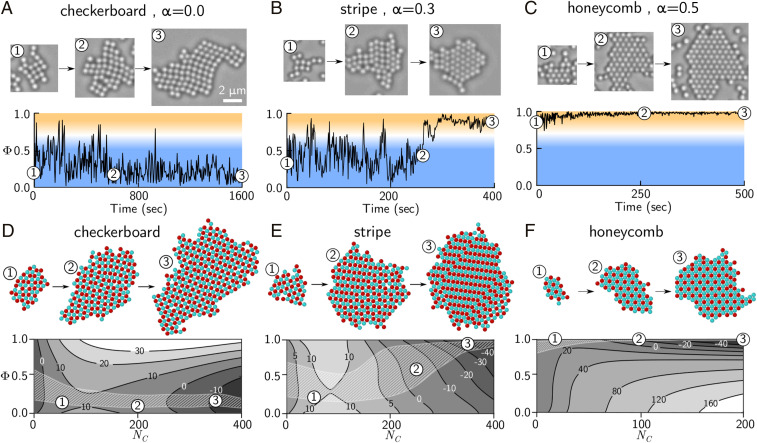
Fig. 4.
Experimental and simulated crystallization pathways for different crystal phases. (A–C) Experimental trajectories of the order parameter as a function of time, for mixing ratios (A), (B), and (C). Snapshots show data of the same crystal at different time points. Blue regions correspond to square symmetry, while orange regions correspond to hexagonal symmetry. (D–F) Free-energy landscapes with respect to the crystal size and order parameter . The white shaded region in each plot encloses 68% of the pathways from 200 independent, unbiased MC simulations. Images show snapshots from unbiased simulations at different crystal sizes . The contours show the free energy in . Results correspond to different interaction matrices: (D), (E), and (F).

