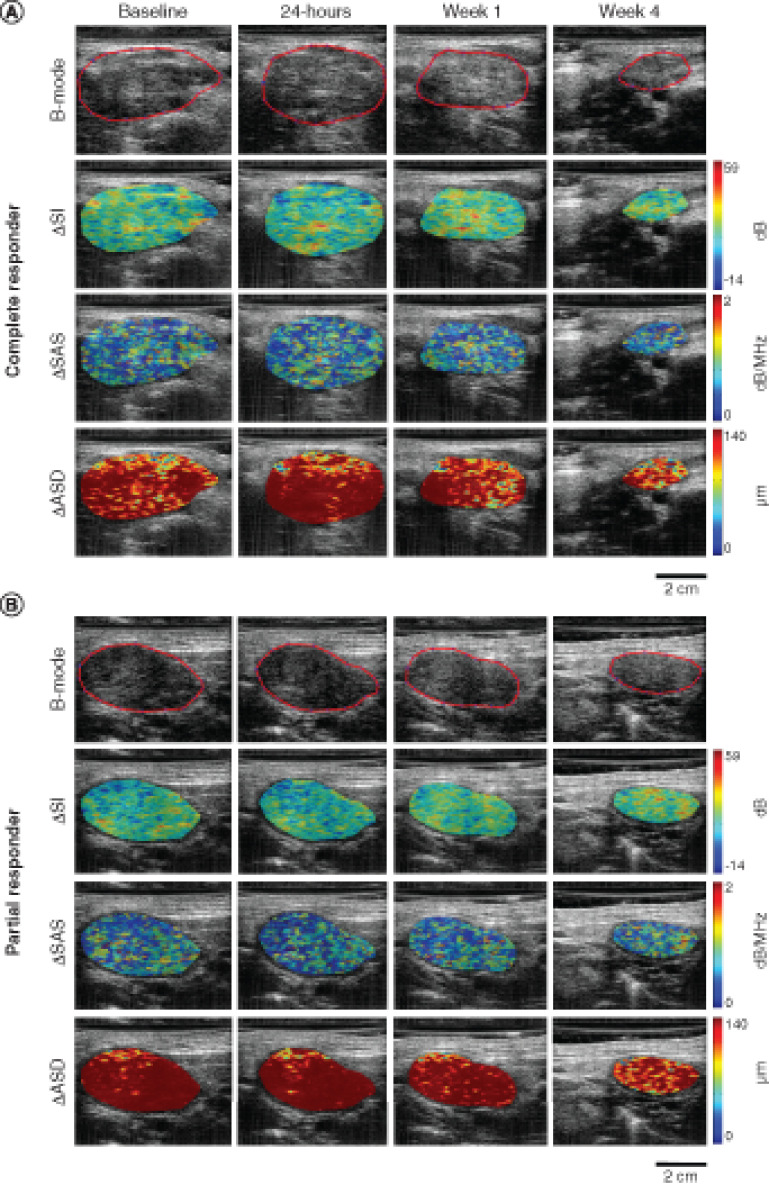
Figure 2. . Quantitative ultrasound parametric maps.
Representative QUS parametric image overlays of ΔSI, ΔSAS and ΔASD at baseline, 24 h, week 1 and 4 of treatment for a complete responder (A) and a partial responder (B). The ultrasound B-mode images have been contoured to delineate the lymph node that was scanned.
ASD: Average scatterer diameter; QUS: Quantitative ultrasound; SAS: Spacing among scatterers; SI: Spectral intercept.

