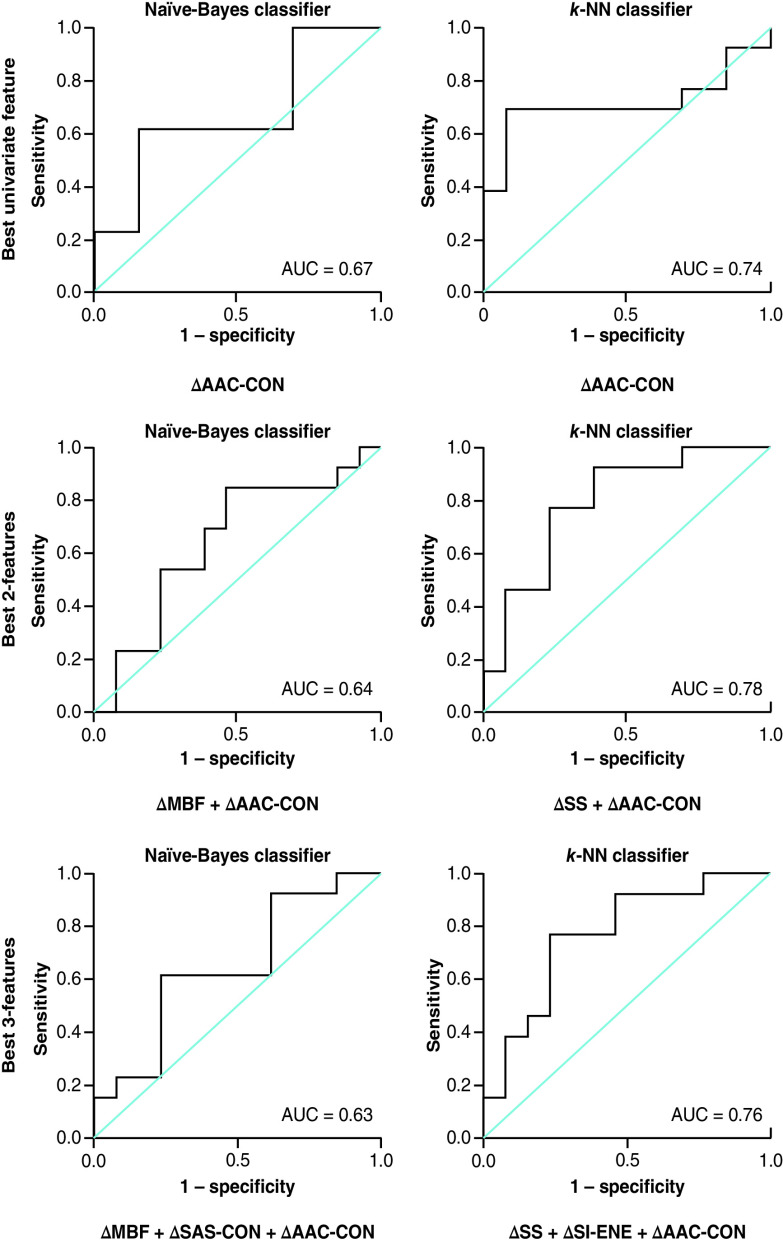
Figure 3. . Results for the best single-, two- and three-feature classification using naive-Bayes and K-nearest neighbor classifier models at 24 h after the initial radiation therapy treatment (receiver operating characteristic curve presented).
AUC: Area under the curve; CON: Contrast; ENE: Energy; K-NN: K-nearest neighbor; MBF: Mid-band fit; SAS: Spacing among scatterers; SI: Spectral intercept; SS: Spectral slope.

