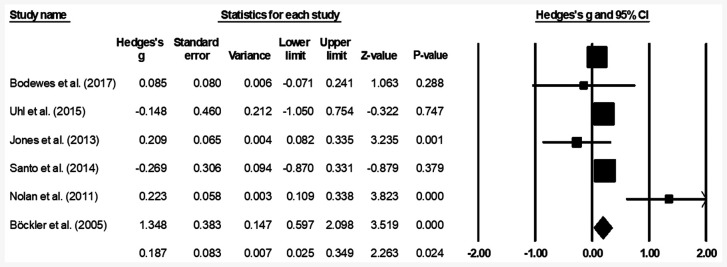
Figure 3.
Mean amputation rate for patients with peripheral lower limb arterial disease. Data are represented as a forest plot comparing patients undergoing bypass surgery with prior history of endovascular operation vs. patients without prior history. Weighted effect sizes are presented as filled squares and 95% CI as whiskers, the size of the squares is proportional to the Hedge's g effect observed in the corresponding study. The overall effect size is represented as a filled diamond. A negative Hedge's g indicates reduced amputation rate in the group with prior history of endovascular operation, whereas a positive Hedge's g is indicative of reduced amputation rate for the group with no prior history of endovascular operation.

