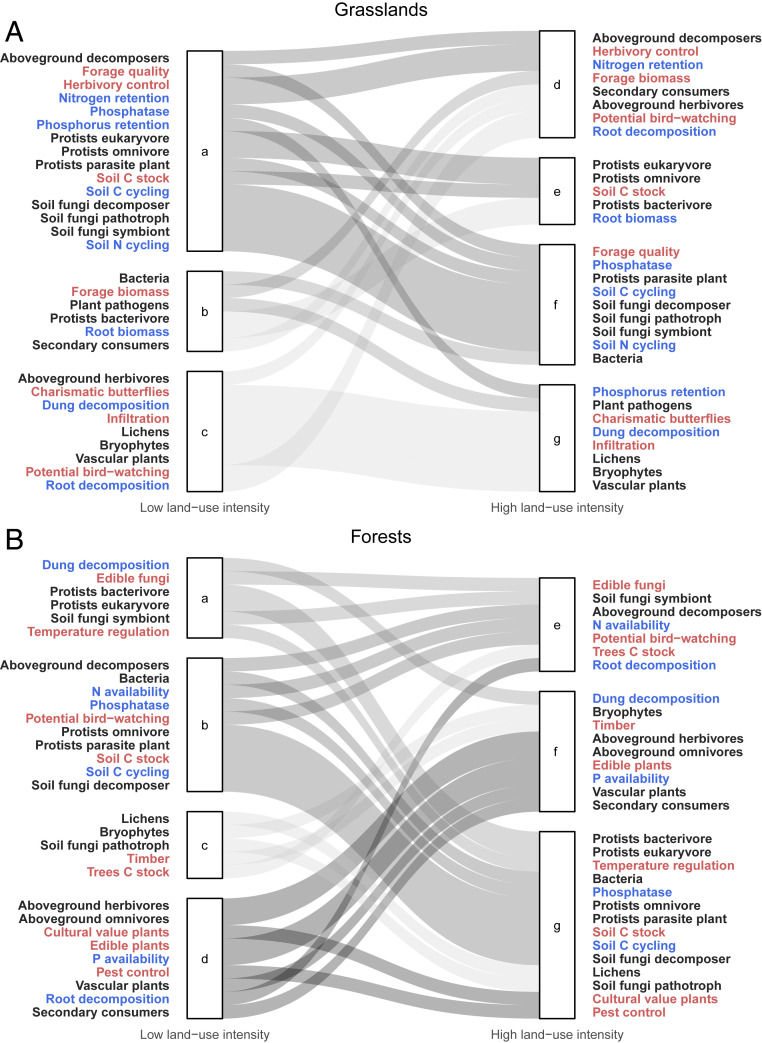
Fig. 3.
Module composition of synergy networks and changes from the networks at the lowest land-use intensity level (left modules) to the highest land-use intensity level (right modules) in grasslands (A) and forests (B). Gray shades indicate the change in module composition from the low management intensity network: black nodes for biodiversity, blue for ecosystem functions, and red for ecosystem services.

