Fig. 1.
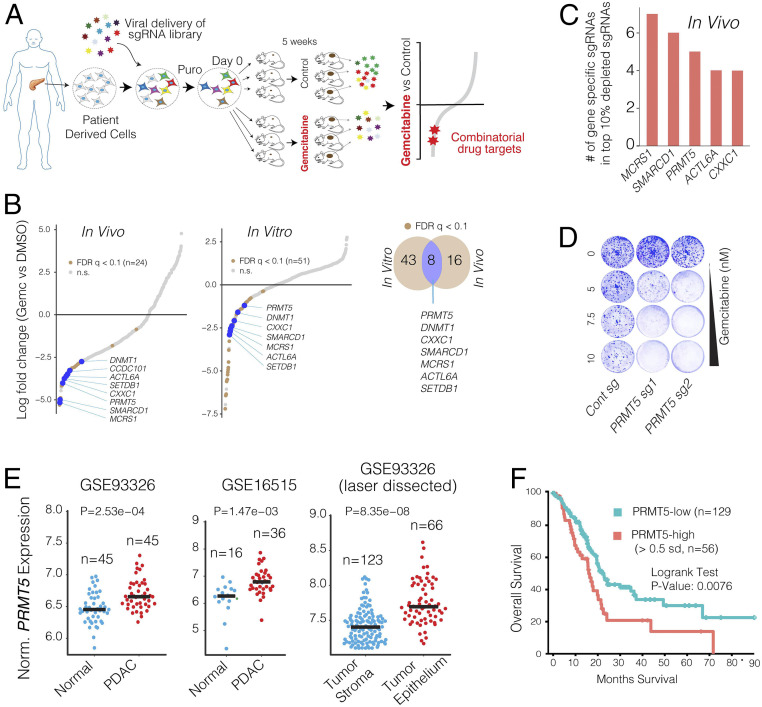
In vivo CRISPR screening identifies PRMT5 as a combinatorial target of Gem. (A) Schematics for in vivo selection screening to identify novel drug combinations. (B) Dot plots show gene-specific CRISPR viability scores. Significantly depleted genes (FDR < 0.1) are labeled with brown dots, whereas the genes that are depleted both in vitro and in vivo are labeled with blue dots. (C) Bar plots show the number of sgRNAs targeting indicated genes among the top 10% of depleted sgRNAs. (D) Crystal violet colony formation assays show the relative cell proliferation rates of cells expressing control and PRMT5 targeting sgRNAs in response to the indicated Gem concentrations. (E) Dot plots show normalized PRMT5 expression levels in normal and matched PDAC tumors. (F) The Kaplan–Meier plot demonstrates survival rates of PDAC patients whose tumors have high PRMT5 expression (>0.5 SDs) relative to the PRMT5-low patients.

