Fig. 2.
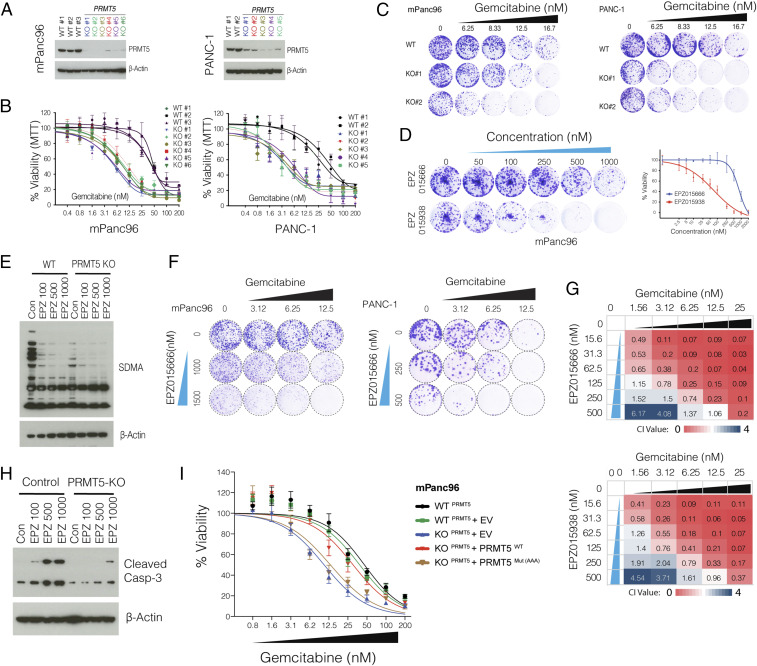
PRMT5-depleted cells are hypersensitive to Gem. (A) Western blot shows PRMT5 protein levels in WT cells, as well as single-cell, expanded clones expressing PRMT5 targeting sgRNAs. The beta-actin level is shown as a loading control. (B) The line graph shows % viability of WT and PRMT5 KO PDAC cells in response to increasing doses of Gem. (C) Crystal violet colony formation assay shows the overall survival of indicated WT and PRMT5 KO cells. (D) Crystal violet colony formation assay shows relative growth inhibition activity of two separate PRMT5 inhibitors. (E) Western blot result shows relative levels of symmetric dimethylation of arginine (SDMA) in WT cells and PRMT5 KO cells treated with increasing concentration (nM) of the indicated PRMT5 inhibitor. (F) Crystal violet colony formation assay shows relative survival and proliferation rates of mPanc96 (Left) and PANC-1 cells (Right) treated with various combinatorial doses of Gem and a PRMT5 inhibitor in two separate cell lines. (G) Heatmaps show the combination index (CI) values across multiple combinatorial doses in PDX 366T cells. CI < 1 indicates synergism for two independent PRMT5 inhibitors. (H) Western blot result shows a relative rate of Caspase-3 cleavage in WT and PRMT5 KO cells treated with increasing doses (nM) of PRMT5 inhibitor. (I) Cell viability results are shown for WT cells as well as PRMT5 KO cells that express WT PRMT5 and an enzymatically inactive mutant form of PRMT5.

