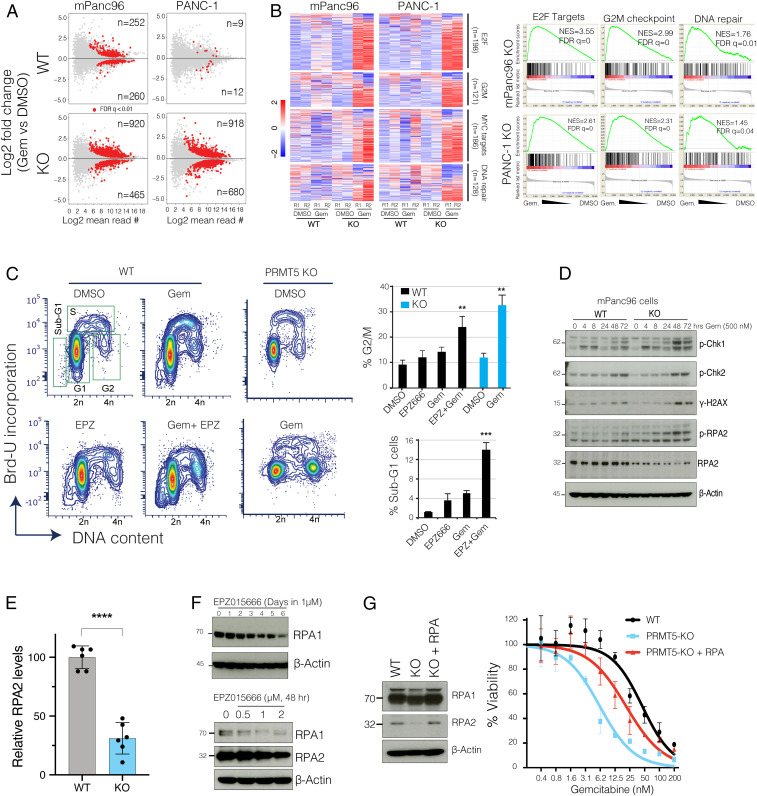
Fig. 3.
PRMT5 depletion results in the aberrant transcriptional program of cell cycle and DNA repair genes in response to Gem. (A) The MA plots (log fold change vs. log mean expression of each gene) show the number of differentially regulated genes in WT and PRMT5 KO cells due to Gem treatment. (B) Heatmaps and GSEA show relative levels of expression changes in genes involved in indicated cellular processes. (C) Flow cytometry cell cycle analysis (DNA content vs. BrdU incorporation) of control vs. Gem (250 nM)-treated WT, PRMT5 KO, or PRMT5 inhibitor EPZ015666 (500 nM)-treated cells. The bar plot shows the percent of cells at the indicated cell cycle stage. ** and *** indicate P values less than 0.01 and 0.001, respectively. (D) Western blots show relative levels of phosphorylated or total levels of indicated proteins. (E) Bar plots of RPA2 protein levels quantified from Western blots. **** indicates P value less than 0.0001. (F) Western blots show levels of RPA1 and RPA2 proteins in PDAC cells treated with various times and doses of the indicated PRMT5 inhibitor. (G) Western blots show relative levels of RPA1 and RPA2 protein levels in WT, PRMT5 KO, and PRMT5 KO cells expressing RPA cDNA. The line plots show the relative viability of indicated cells in response to increasing doses of Gem.

