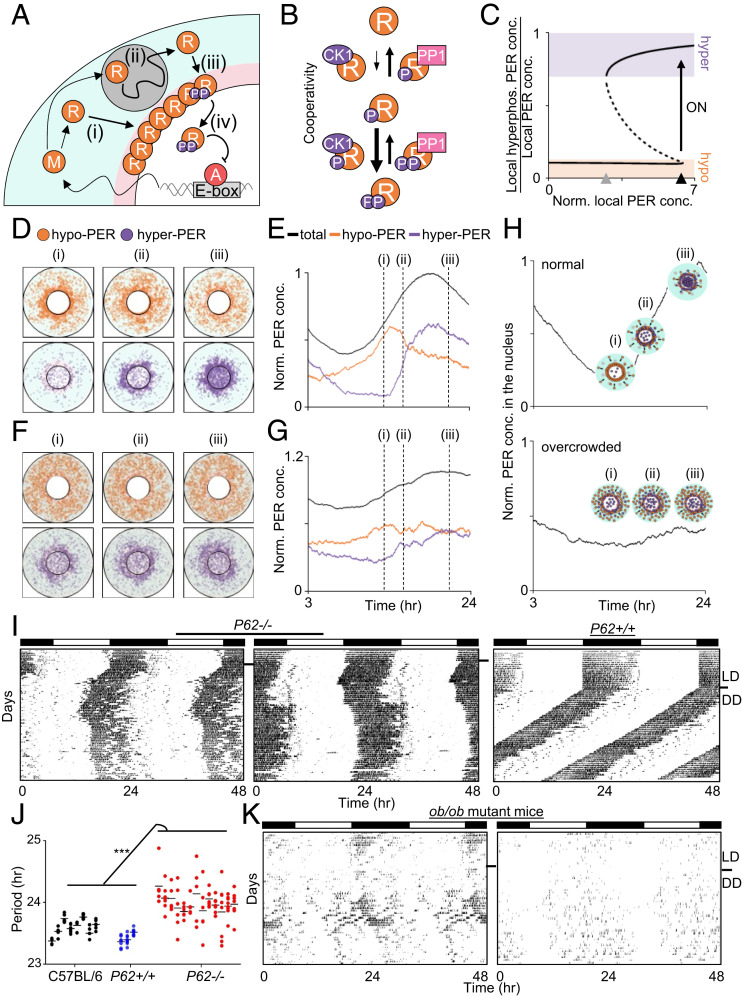
Fig. 3.
Unique spatiotemporal regulation of PER generates a bistable switch in hyperphosphorylation for nuclear entry. (A) Diagram of the spatial stochastic model of the circadian clock. After Per mRNA, M, is translated to protein, R, in the cytoplasm (i), PER transits toward the perinucleus, past obstacles while being hypophosphorylated (ii; gray circle). The accumulated PER in the perinucleus is hyperphosphorylated (iii). Then it enters the nucleus and inhibits the transcriptional activity of the activator, A (iv). More details are provided in SI Appendix. (B) In the model, hyperphosphorylation of PER occurs faster than hypophosphorylation due to cooperativity. For simplicity, one phosphate group and two phosphate groups were modeled as hypophosphorylation and hyperphosphorylation, respectively. (C) This leads to the bistability in PER hyperphosphorylation. When the “local” concentration of cytoplasmic PER reaches the switch-on threshold (black triangle), the fraction of hyperphosphorylated PER sharply increases. Then the high fraction persists for awhile even when the local concentration of PER decreases, until the switch-off threshold is reached (gray triangle). The solid and dashed lines indicate the stable and unstable steady states, respectively. More details are provided in SI Appendix, Fig. S6. (D and E) Snapshots of the simulated spatial distribution of PER (D) and the simulated trajectories of PER concentration (E). The cytoplasmic flux over several hours increases PER abundance in the perinucleus (D, pink region in A) compared with the peripheral cytoplasm (D, cyan region in A). This induces a sharp switch-like hyperphosphorylation in the perinucleus due to the cooperativity (ii), followed by synchronous nuclear entry within a narrow time window (iii). (F and G) When a cell is overcrowded (dark background), the cytoplasmic flux is hindered, and thus PER does not accumulate in the same gradient as in the normal cell (i). This disables the sharp switch-like PER hyperphosphorylation and nuclear entry (ii and iii) (details in SI Appendix, Fig. S7). (H) Simulated temporal nuclear PER in a normal and an overcrowded cell. Note that PER concentration in C, E, and G and nuclear PER concentration in H are normalized by the peak level of total PER and that of nuclear PER in a normal cell, respectively. (I and J) P62 mutant mice showed unstable, lengthened rhythms. Periods were calculated as in Fig. 1D. Data for C57BL/6J were copied from Fig. 1D. (K) ob/ob mutant mice showed lengthened and unstable rhythms (n = 6).

