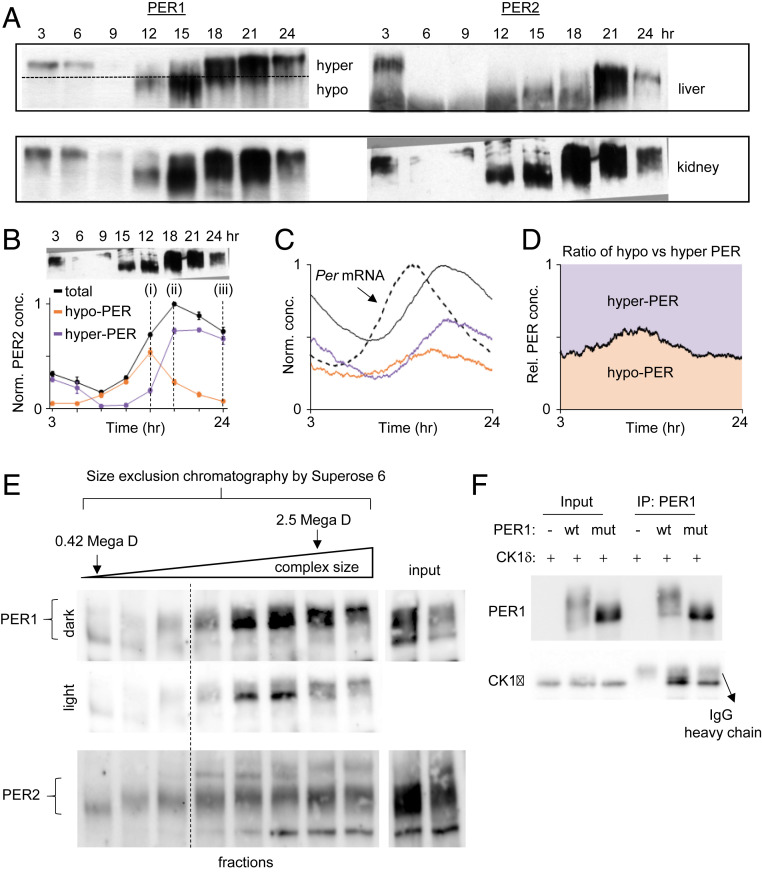
Fig. 4.
The bistable phosphoswitch model is further supported by other lines of experimental evidence. (A and B) PER phosphorylation in vivo exhibits two different levels of phosphorylation and jumps from hypophosphorylated to hyperphosphorylated states around the nuclear entry time (ZT15 to 18) (10). Hypophosphorylated PER species are not detectable after approximately CT21 because Per mRNA levels would be at trough levels once the majority of PER molecules enter the nucleus and inhibit CLOCK:BMAL1 (10). (C and D) If there were no bistability, both hypophosphorylated and hyperphosphorylated PER species would be observed at all times despite robust mRNA rhythms. This result was obtained by removing bistability from our mathematical model (Fig. 3A). (E) Size exclusion chromatography reveals that phosphorylation states are associated with complex size. U2OS cell extracts were fractionated in a Superose 6 column (GE Healthcare) and immunoblotted for PER1 and PER2. Fractions after the void volume of the column are shown. Note that the first fraction and the second to last fractions were where proteasome lid-L20 (0.42 MDa) and whole particles (2.5 MDa) were eluted (63, 64). We believe that hyperphosphorylation can occur only when PER complexes grow to a certain size through PER-PER multimerization, which is facilitated by local enrichment. (F) The PAS dimerization domain is critical for hyperphosphorylation of PER. WT and mutant (W448E) PER1 were transiently expressed along with CK1δ in 293A cells. Cell extracts were immunoprecipitated with anti-PER1 antibody, and the immune complexes were immunoblotted for CK1δ and PER1.

