Fig. 4.
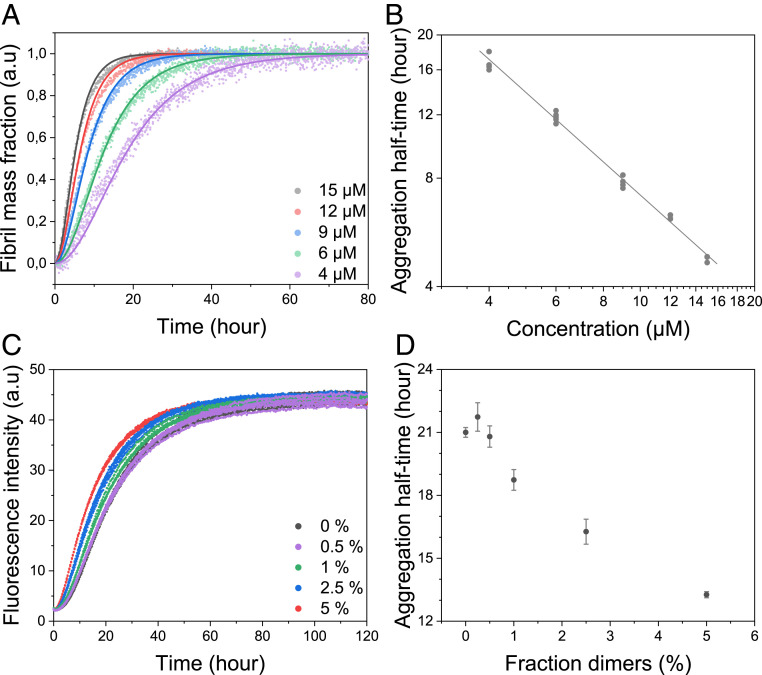
(A) Aggregation kinetics of dimeric apo β-PV as function of concentration (monomer equivalents given), as measured by ThT fluorescence at 37 °C under quiescent conditions (150 mM NaCl, 1 mM CaCl2, 5 mM EDTA, and 25 mM Tris⋅HCl pH 7.4). The solid lines represent fits to data based on a primary nucleation model in the AmyloFit web interface (7) (SI Appendix, Fig. S2C, nonnormalized data). (B) Double-logarithmic plot of half-time vs. apo β-PV dimer concentration from ThT aggregation data. (C) ThT fluorescence of apo β-PV aggregation in the presence of 0 to 5% (monomer equivalent) apo β-PV dimers (50 µM total apo β-PV) under the same conditions as described in A. (D) Half-time plot of the data reported in C vs. fraction of added dimers.

