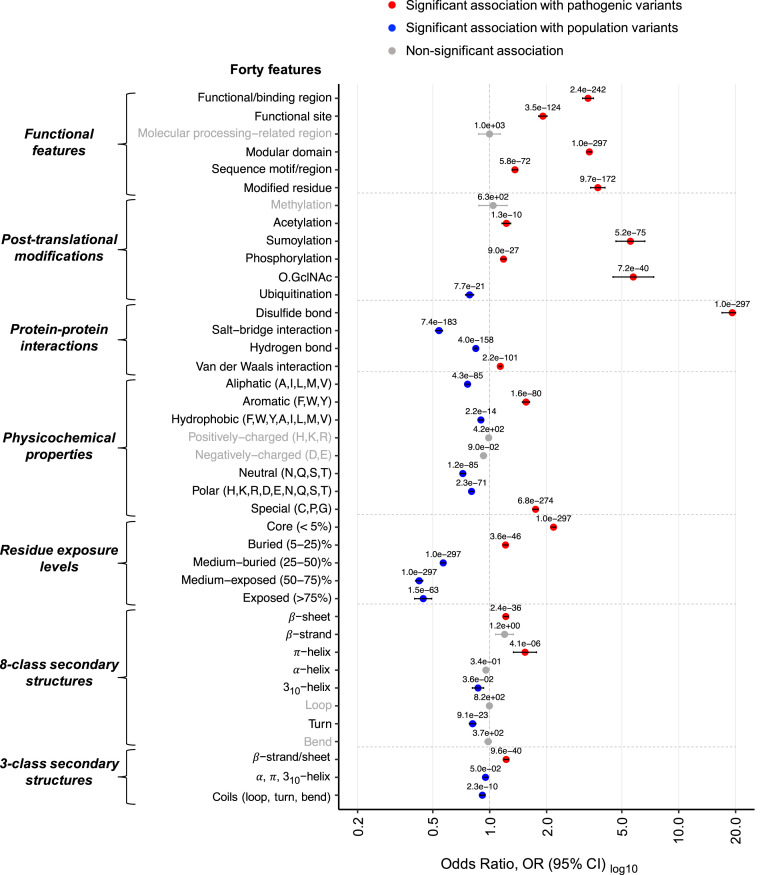
Fig. 2.
Association of pathogenic and population missense variations with 40 3D features (a combination of structural, physicochemical, and functional features of amino acids on protein structure) for 1,330 disease-associated genes (DAGS1330 set). The plot shows the results of two-sided Fisher’s exact tests of association between 32,923 pathogenic and 164,915 population amino acid variations with the features. Circles show the OR and are labeled with the values (the corrected values; see Materials and Methods), showing the significance of the association (a value of 1.0e-297 should be read as 1.0e-297, indicating the maximum significance), and the horizontal bars show the 95% CI. The OR > 1 and OR < 1, along with 0.05, indicate that the corresponding feature (y axis) is enriched in pathogenic (red circle) and population (blue circle) variants, respectively. The vertical dashed line at OR = 1 indicates no association between a variant type (pathogenic or population) and a feature. To facilitate the visualization, minimum and maximum values of OR along the x axis are set to 0.2 and 20.0, respectively. For nonsignificant association ( 0.05), the circle, CI bar, and feature names are gray.

