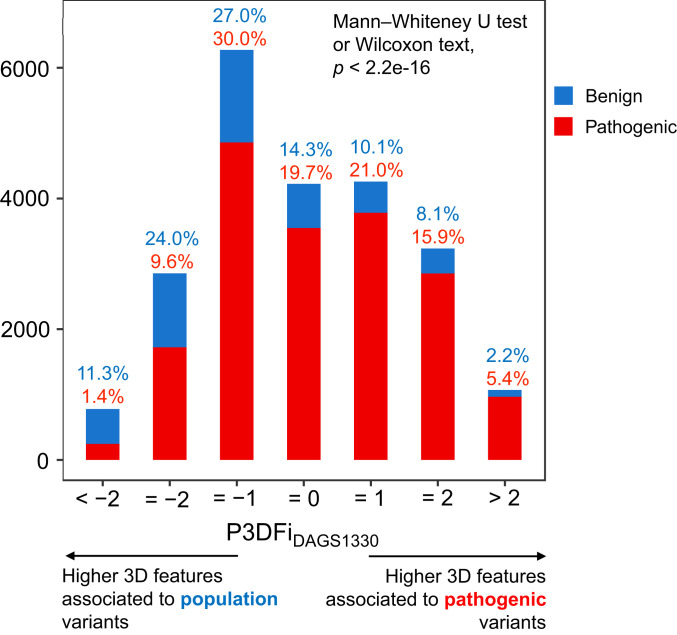
Fig. 4.
Distribution of pathogenic 3D feature index (P3DFiDAGS1330) values in an independent set of 22,695 variants (17,983 pathogenic and 4,712 benign). The plot shows the count of pathogenic and benign variants (y axis) in different P3DFiDAGS1330 bins (x axis) for 1,286 genes of all protein classes. The bin labels report the fraction of pathogenic and benign variants in each bin out of the total pathogenic and benign variants. In the plot, the pathogenic and benign variants show opposing distribution trends in the positive and negative P3DFi values (Mann–Whitney U test or Wilcoxon test of significance, 2.2e-06).

