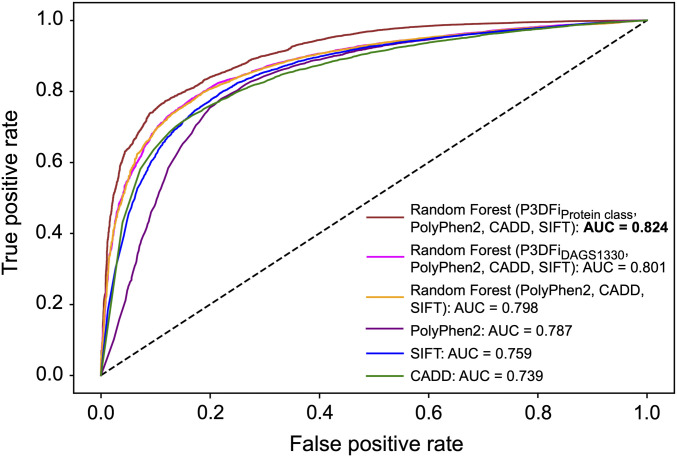
Fig. 5.
Comparison of the receiver operating characteristic (ROC) curves. The curves are drawn using the scores generated by six methods (Table 1) in predicting 22,362 variants (17,983 pathogenic and 4,655 benign). The plot is further labeled with the area under the curve (AUC) values. The “Random forest” ensemble model trained on P3DFiProtein class (derived in this study), SIFT (11), PolyPhen2 (9), and CADD (48) scores provided the best AUC value of 0.824 (boldfaced).

