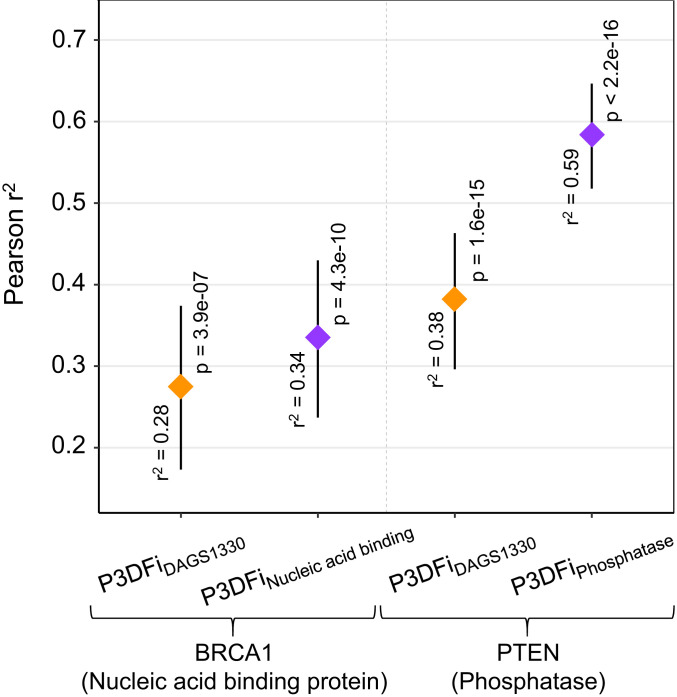
Fig. 6.
Comparison of the saturation mutagenesis screening readouts and P3DFi values (derived in this study). The figure shows the output of Pearson’s product moment correlation tests between the mean fitness scores from the mutagenesis experiment per amino acid (to all possible substitutions) and both the P3DFiDAGS1330 and P3DFiProtein class values for two proteins: BRCA1 (50) and PTEN (51). The diamonds show the estimated correlation values (Pearson ). Vertical bars show the 95% CIs and are labeled with the significance (p values) of the test result. The correlation between experimental outputs measuring the functional consequence of mutations and the protein function-specific P3DFi (P3DFiPhosphatase for PTEN and P3DFiNucleic acid binding for BRCA1) are higher than that of the P3DFiDAGS1330 values for both proteins. These results illustrate that 3D features specific to the protein function can provide a substantial advantage in correctly interpreting the consequences of missense variations.

