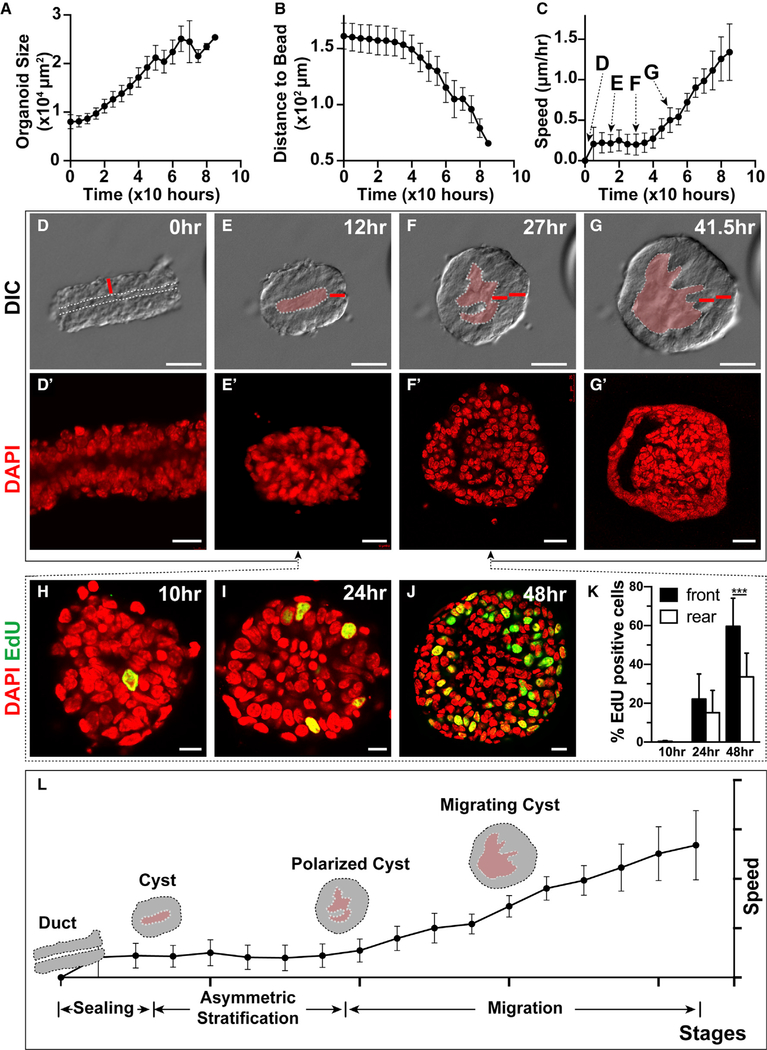
Figure 2. Front-Rear Polarity of the Epithelium Is Set Up by Differential Cell Proliferation.
(A–C) Organoid size (A), distance to the bead (B), and speed (C), as measured every 5 h during the 3-day course of collective migration. Note that organoids started to move after ~30 h (n = 15).
(D–G′) Still DIC images of organoid during migration (D)–(G). The distinctive changes in organoid epithelial morphology imply the presence of substages during the migration process. Note that the increase in the thickness of the epithelial wall preceded migration. The white dotted line denotes lumen cavity. The red bar indicates the thickness of a normal epithelial duct at time 0. Scale bars, 100 μm. (D′)–(G′) DAPI nuclear staining indicates that changes in the thickness of the cyst epithelium are caused by an increased number of cells via stratification, rather than by cell enlargement. Scale bars, 20 μm.
(H–K) EdU incorporation based cell proliferation analysis between the cyst (E) and the stratification (F) stages. Quantification (K) indicates that more cells underwent proliferation in the front than in the rear of the organoid, suggesting stratification was not a result of cell rearrangement. Scale bars, 10 μm. Student’s t test, ***p < 0.001, 10 h, n = 10; 24 h, n = 8; 48 h, n = 9.
(L) Diagram indicates the distinct stages of epithelial migration, including the sealing, cyst, polarized cyst, and migrating cyst stages.

