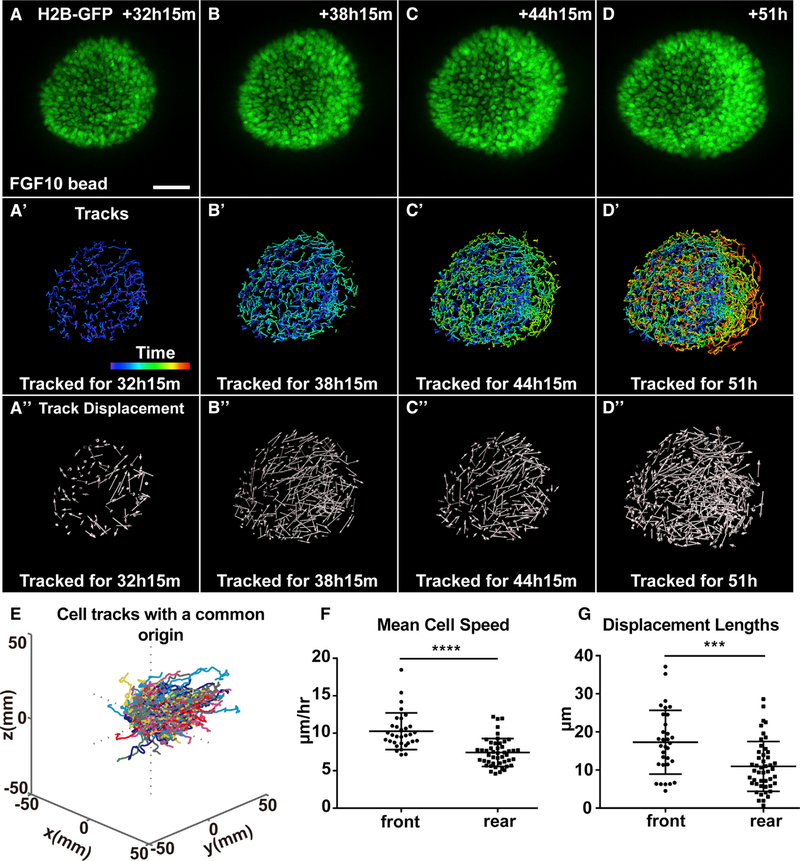
Figure 5. Front Cells Move Faster and More Directionally Than Rear Cells Do during Collective Migration.
(A–D″) Analysis of cell behavior during collective migration of organoid epithelium in response to the FGF10 bead. Note, beads were placed to the right of the organoid epithelium and outside the view. (A–D) Maximum intensity projections from 3D confocal videos of organoid epithelium derived from female mice carrying the H2B-GFP (green) transgene. Scale bars, 50 μm. (A′–D′) Time course of nuclei trajectories for the indicated durations. Purple and red colors of the time bar indicate the beginning and end of the video, respectively. Cells were tracked for 25, 49, 73, and 100 frames, respectively, in (A′), (B′), (C′), and (D′), respectively. (A″–D″) Cell displacement at the indicated times. Arrows represent cell displacement directions. Cell displacement was tracked at the indicated durations using 25, 49, 73, and 100 frames in (A″), (B″), (C″), and (D″), respectively.
(E) 3D rendering of cell tracks when plotted with a common origin. Cells were tracked for 86.75 h (244 frames). Note cell tracks were preferentially toward the right side where an FGF10 bead was located.
(F) Mean cell speeds, as calculated from nuclear trajectories in which track lengths were divided by time.
(G) Displacement lengths of analyzed cells. A total of eight organoids were analyzed, but only data from two representative organoids were combined to generate (F) and (G) (front cells, n = 32; rear cells, n = 47). Frame interval was 15 min. Unpaired Student’s t test was used for statistical analysis. ****p < 0.0001, ***p < 0.001.

