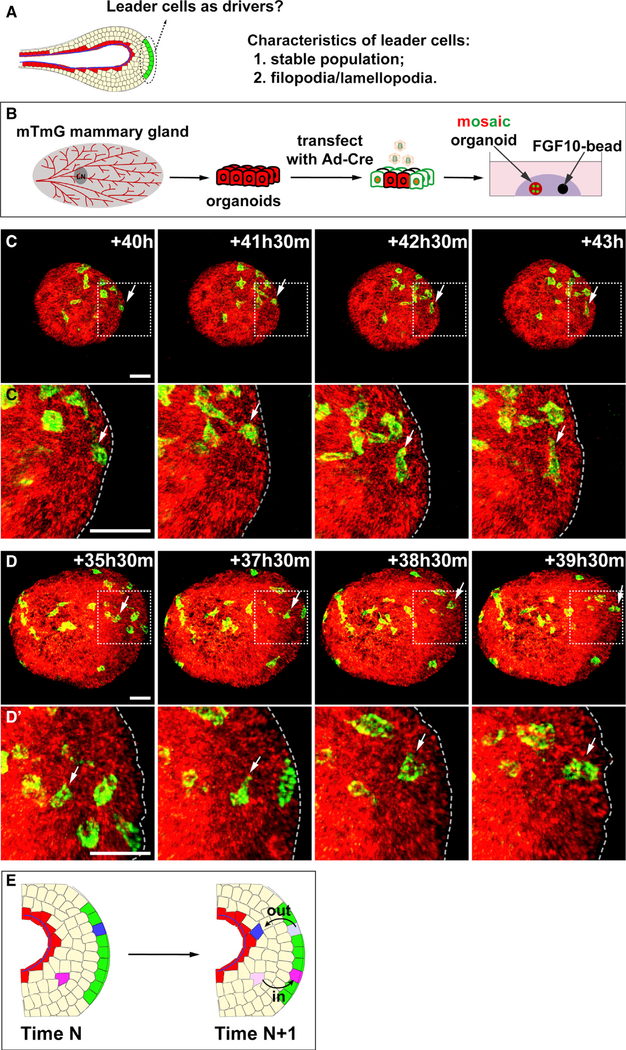
Figure 6. Leader Cells in the Migrating Epithelium Are a Dynamic Cell Population.
(A) Schematic diagram depicting the hypothetical zone of leader cells at the epithelial invasion front.
(B) Schematic diagram showing the experimental procedure in sample preparation, adenoviral infection, and labeling of individual cells during time-lapse confocal imaging. Mammary organoids were harvested from R26RmTmG mice and were infected with adenoviral Cre. Cell movement was recorded during organoid migration.
(C–D′) 3D reconstructed views of individual cell movement tracked during the time frames indicated. Areas in rectangles with white dashed lines are shown in close-up views in (C′) and (D′). Arrows indicate the cells in question, with (C) and (C′) showing a cell initially at the leading position moved outside with time, whereas (D) and (D′) depict a cell initially outside of the leading position moved into it with time. Scale bars, 20 μm.
(E) Summary illustrating a lack of stable leader-cell population (green) during directional epithelial migration, in which, unlike in other collective migration systems, cells (blue and pink) can move in (pink cell) and out (blue cell) of the leading position of the epithelium.

