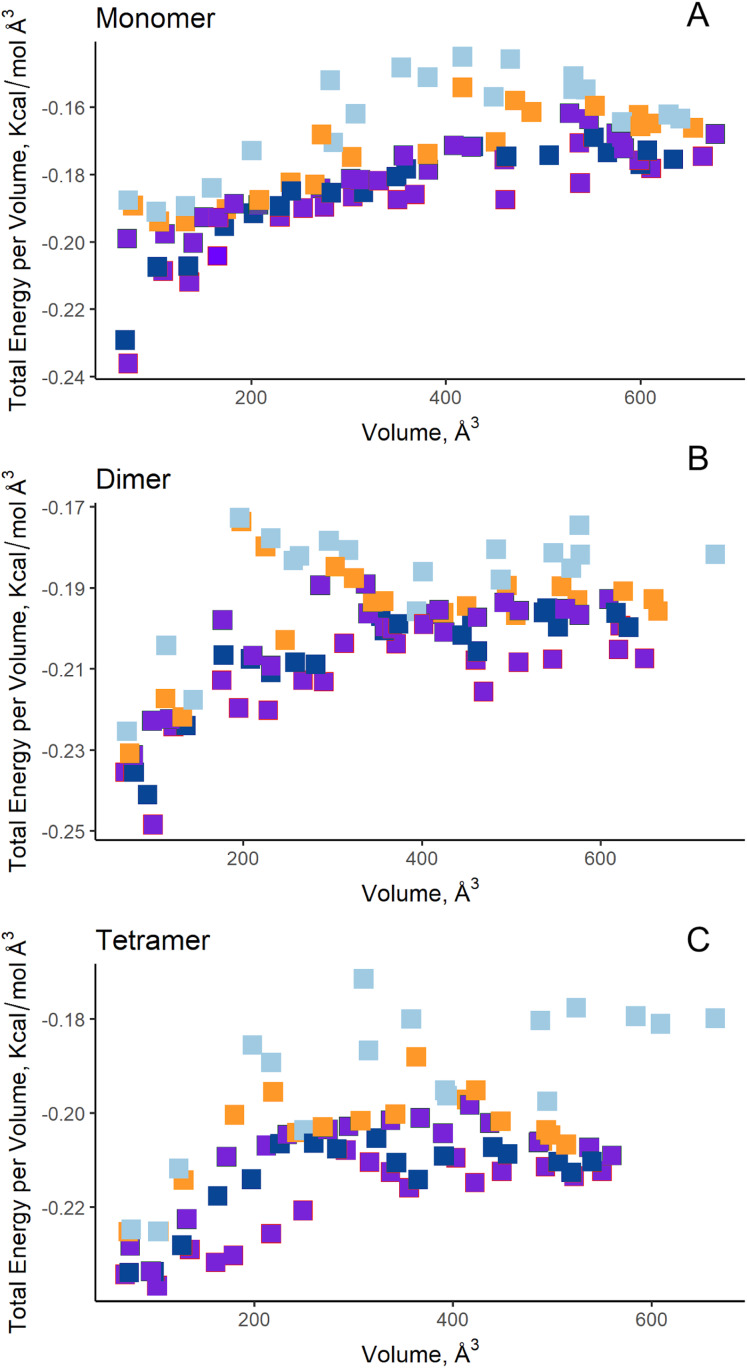
Figure 7. AutoLigand results for EcAII.
The minima observed in the total energy graphs per unit volume represent putative binding sites in the structures analyzed, for (A) the monomer, (B) dimer, and (C) tetramer conformation. As more filling points are used, the binding sites, cavities, or grooves are filled and the affinity decreases. The best sites are the ones with the lowest energy and the lowest volume.

