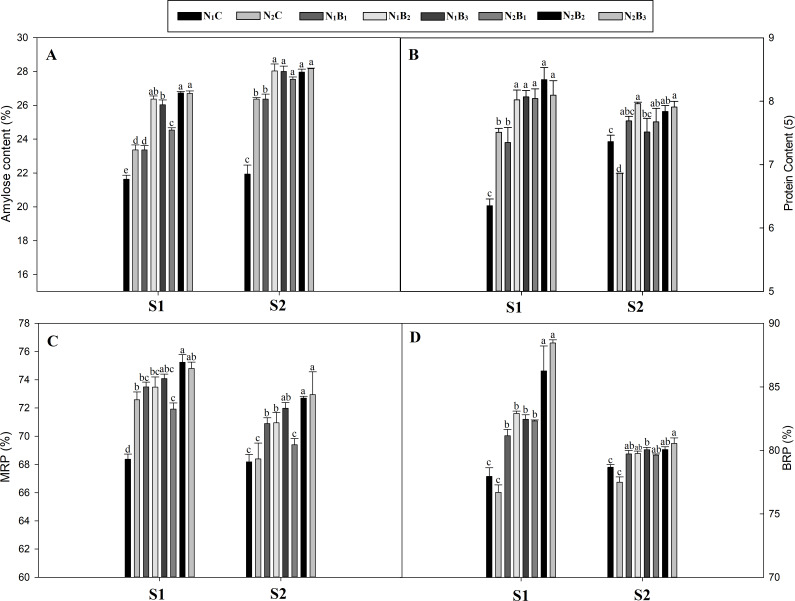
Figure 2. Effect of biochar and nitrogen levels on amylose content, protein content, milled rice percent and brown rice percent in noodle rice.
MRP, Milled rice percent; BRP, Brown rice percent; S1 and S2: indicates season first and season second, Vertical bars represent the standard error of mean. (A) Amylose content; (B) protein content; (C) milled rice percent; (D) brown rice percent.

