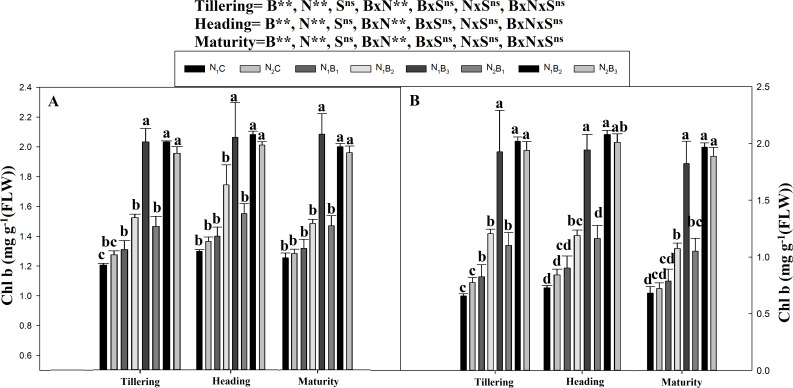
Figure 5. Chlorophyll (b) mg g−1 as influenced by biochar and nitrogen levels during three growth stages and two sowing seasons.
Note: N1C–N; lower dose + Control (no biochar), N2C–N; higher dose + Control (no biochar), N1B1–N; lower dose + Biochar 20 t ha−1, N1B2–N; lower dose + Biochar 40 t ha −1, N1B3–N; lower dose + Biochar 60 t ha−1, N2B1–N; higher dose + Biochar 20 t ha−1, N2B2–N; higher dose + biochar 40 t ha−1, N2B3–N; higher dose + Biochar 60 t ha−1,The vertical bar represents standard error of the mean. (A) Chlorophyll-b during S1 and (B) chlorophyll-b during S2.

