
FIGURE 5.
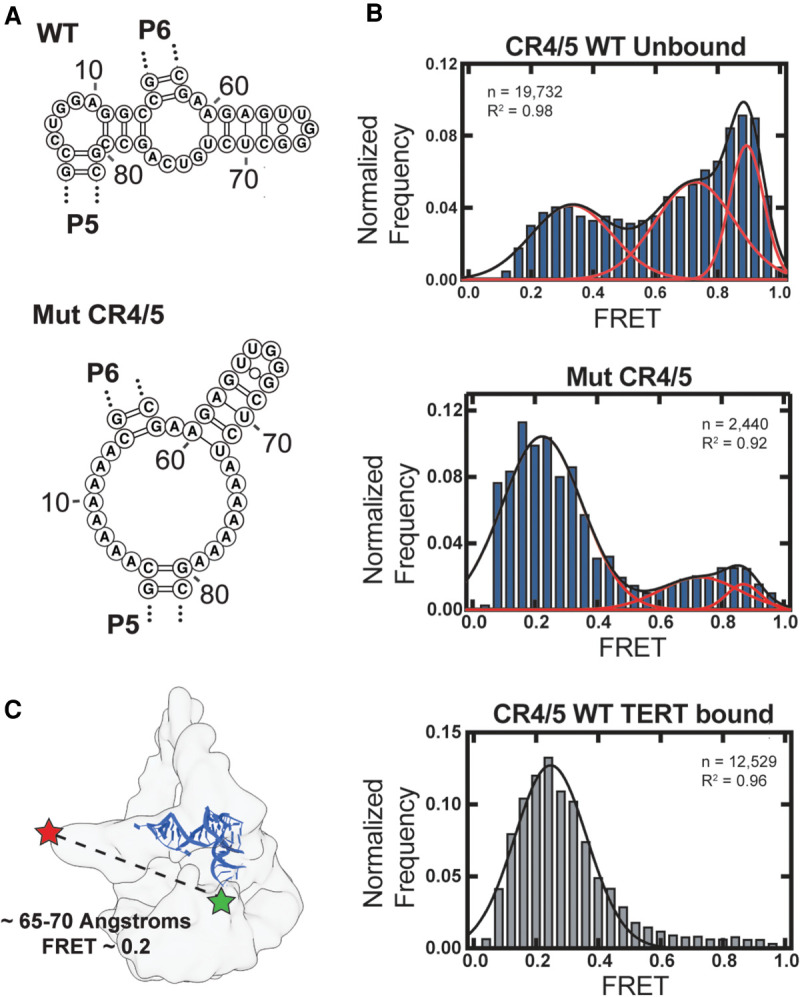
Single-molecule FRET analysis of hTR CR4/5 domain. (A) RNAstructure predicted junction structures for WT hTR CR4/5 (top panel) and Mut CR4/5 (middle panel). (B) Histograms of smFRET data collected in the presence of 1 mM MgCl2 using a confocal microscope of freely diffusing CR4/5 molecules in solution. WT CR4/5 (top panel), Mut CR4/5 (middle panel), and WT CR4/5–TERT complex (bottom panel). Red and black lines depict Gaussian functions manually fit to the data with associated R2. (C) Cryo-EM density of human telomerase (EMD-7518) (Nguyen et al. 2018) with the medaka CR4/5 crystal structure (blue, derived from the CR4/5-TRBD structure PDB 4O26) (Huang et al. 2014) manually docked. Approximate locations of each FRET dye are indicated and the distance between these positions within the structural model is indicated together with the estimated FRET value calculated from a Cy3-Cy5 Förster radius of 57 angstroms.