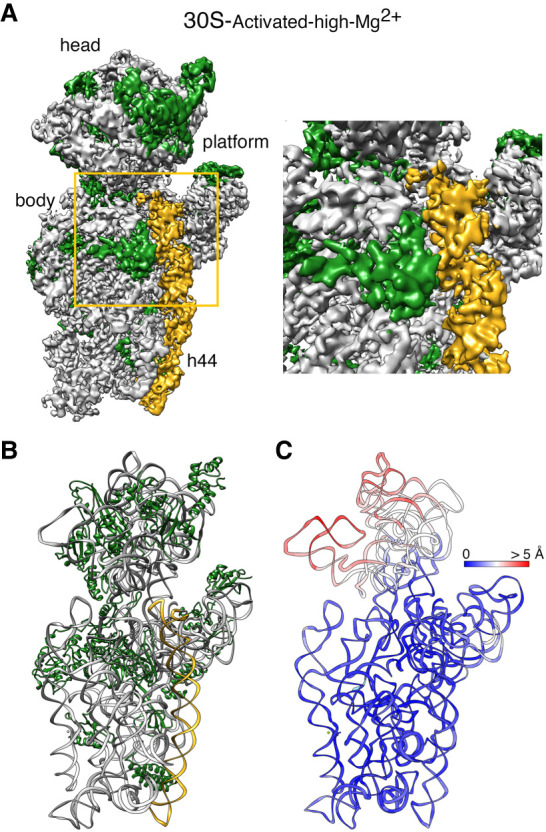
FIGURE 4.

Cryo-EM structure of the 30S-activated-high-Mg2+ particle. (A) Front view (left panel) of the cryo-EM map obtained for the 30S-activated-high-Mg2+ particle. The framed area is shown as a zoomed-in view in the right panel. The main landmarks of the 30S subunit are labeled. The rRNA is shown in light gray, and the r-proteins are shown in green. Helix 44 is shown in goldenrod orange. (B) Molecular model of the 30S-activated-high-Mg2+ particle. The rRNA and the r-proteins are colored as in panel A. (C) Temperature map of the 30S-activated-high-Mg2+ molecular model. The rRNA is colored according to the r.m.s.d. deviation (Å) with respect to the structure of the 30S subunit obtained by X-ray crystallography (PDB ID 4V4Q).
