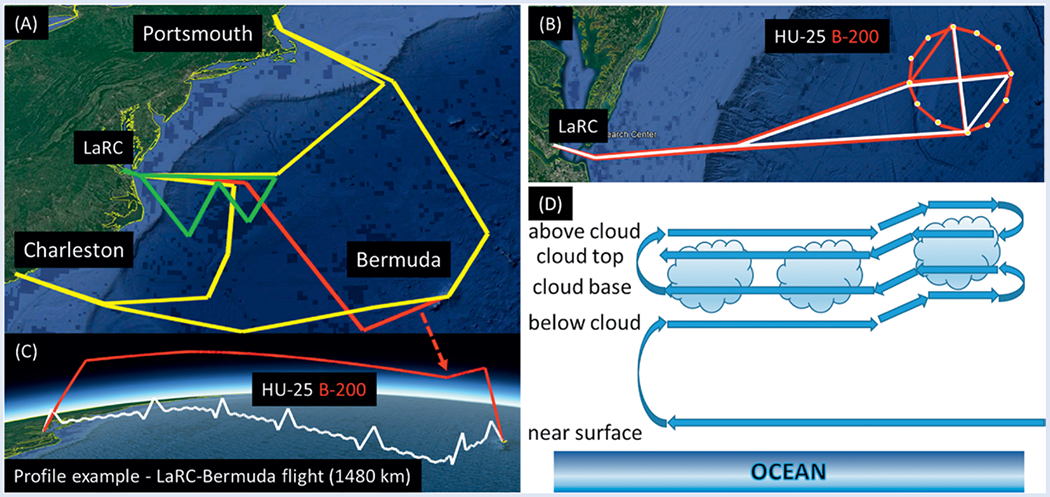
Fig. SB1.

Example of the (a),(c) statistical survey and (b),(d) process study flight patterns from the primary base (LaRC) and secondary bases (Charleston, Portsmouth, and Bermuda) of operations, with (d) being specifically for the low-flying aircraft. The colors in (a) distinguish the different patterns: yellow shows flights between potential secondary bases, red is the same and is highlighted to match the profile shown in (c), and green is a local flight from LaRC (similar local flights from secondary bases are possible but not shown). These flight patterns show the flexibility and range for intensive MBL cloud sampling to address ACTIVATE objectives.
