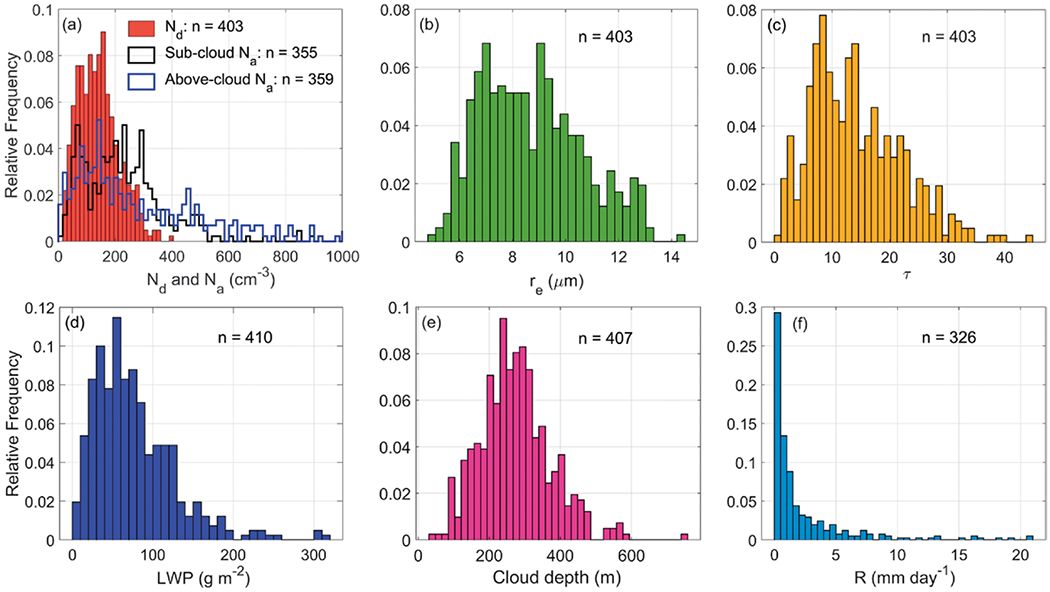
Fig. 3.

Histograms summarizing the range of conditions associated with aerosol and cloud parameters during the six Twin Otter campaigns. Some of the x axes extend to higher values but are truncated here to better represent the variability of the majority of the cases. Values for Nd, re, τ, LWP, cloud depth, and R represent cloud-columnar mean values.
