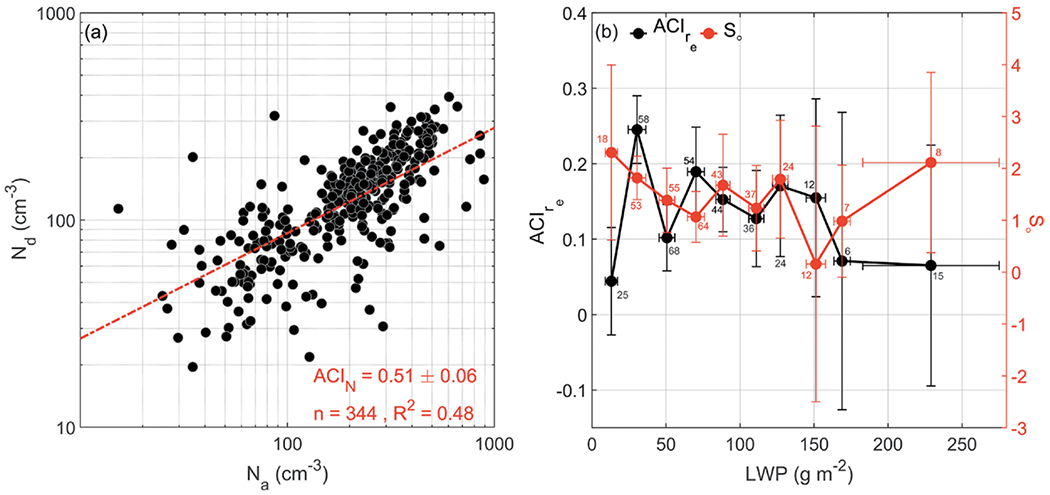
Fig. 5.

Aerosol–cloud interactive analyses using the cumulative dataset from the Twin Otter campaigns. (a) Comparison of Nd vs Na, where the slope is equal to ACIN in Eq. (1). (b) LWP-dependent values of aerosol–cloud interaction metrics defined in Eqs. (2) and (3). The number of data points used for quantification of So and ACIre in each LWP bin is shown in red and black, respectively. A major limitation in the campaigns was the lack of statistics to bin the data in tighter LWP bins and to hold other nonaerosol factors fixed to reduce the size of the standard deviations.
