Figure 1.
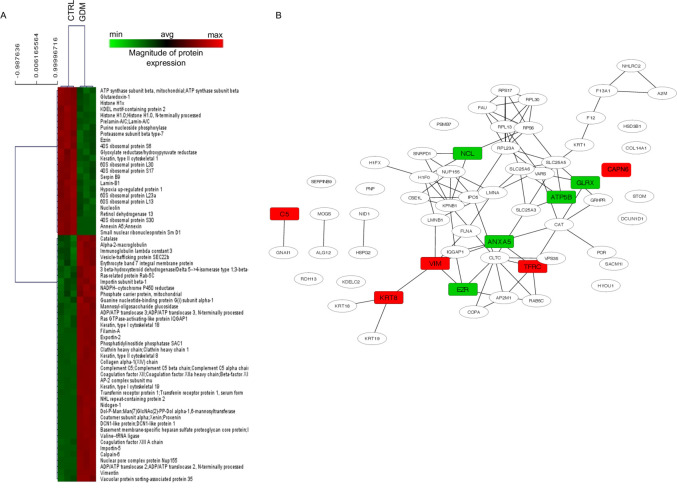
Placental proteomic profile of GDM versus CTRL women. (A) Heat MAP representing the placental proteomic profile of women with GDM as compared with that of healthy subjects (CTRL). The complete dataset of identified and quantified proteins was subjected to statistical analysis (p<0.001). Significantly differentially expressed proteins were further analyzed via hierarchical clustering. Placental lysates of five CTRL and five GDM women were analyzed. (B) Protein–protein interaction network of differentially expressed proteins in placentas of GDM women as compared with CTRL. Nodes represent proteins, and edges represent degrees of connectivity. Enrichment of the node was performed with BINGO, a plug-in for Cytoscape. Rectangular-shaped nodes indicate the upregulated (red) and downregulated (green) proteins in GDM compared with CTRL samples and described to play a role in trophoblasts structure and function (eg, invasion, angiogenesis, oxidative stress, barrier and energy support), fetal development (iron, muscle differentiation and nutrients) and protection from fetal loss (anticoagulant and regulation of epithelial-to-mesenchymal transition). GDM, gestational diabetes mellitus.

