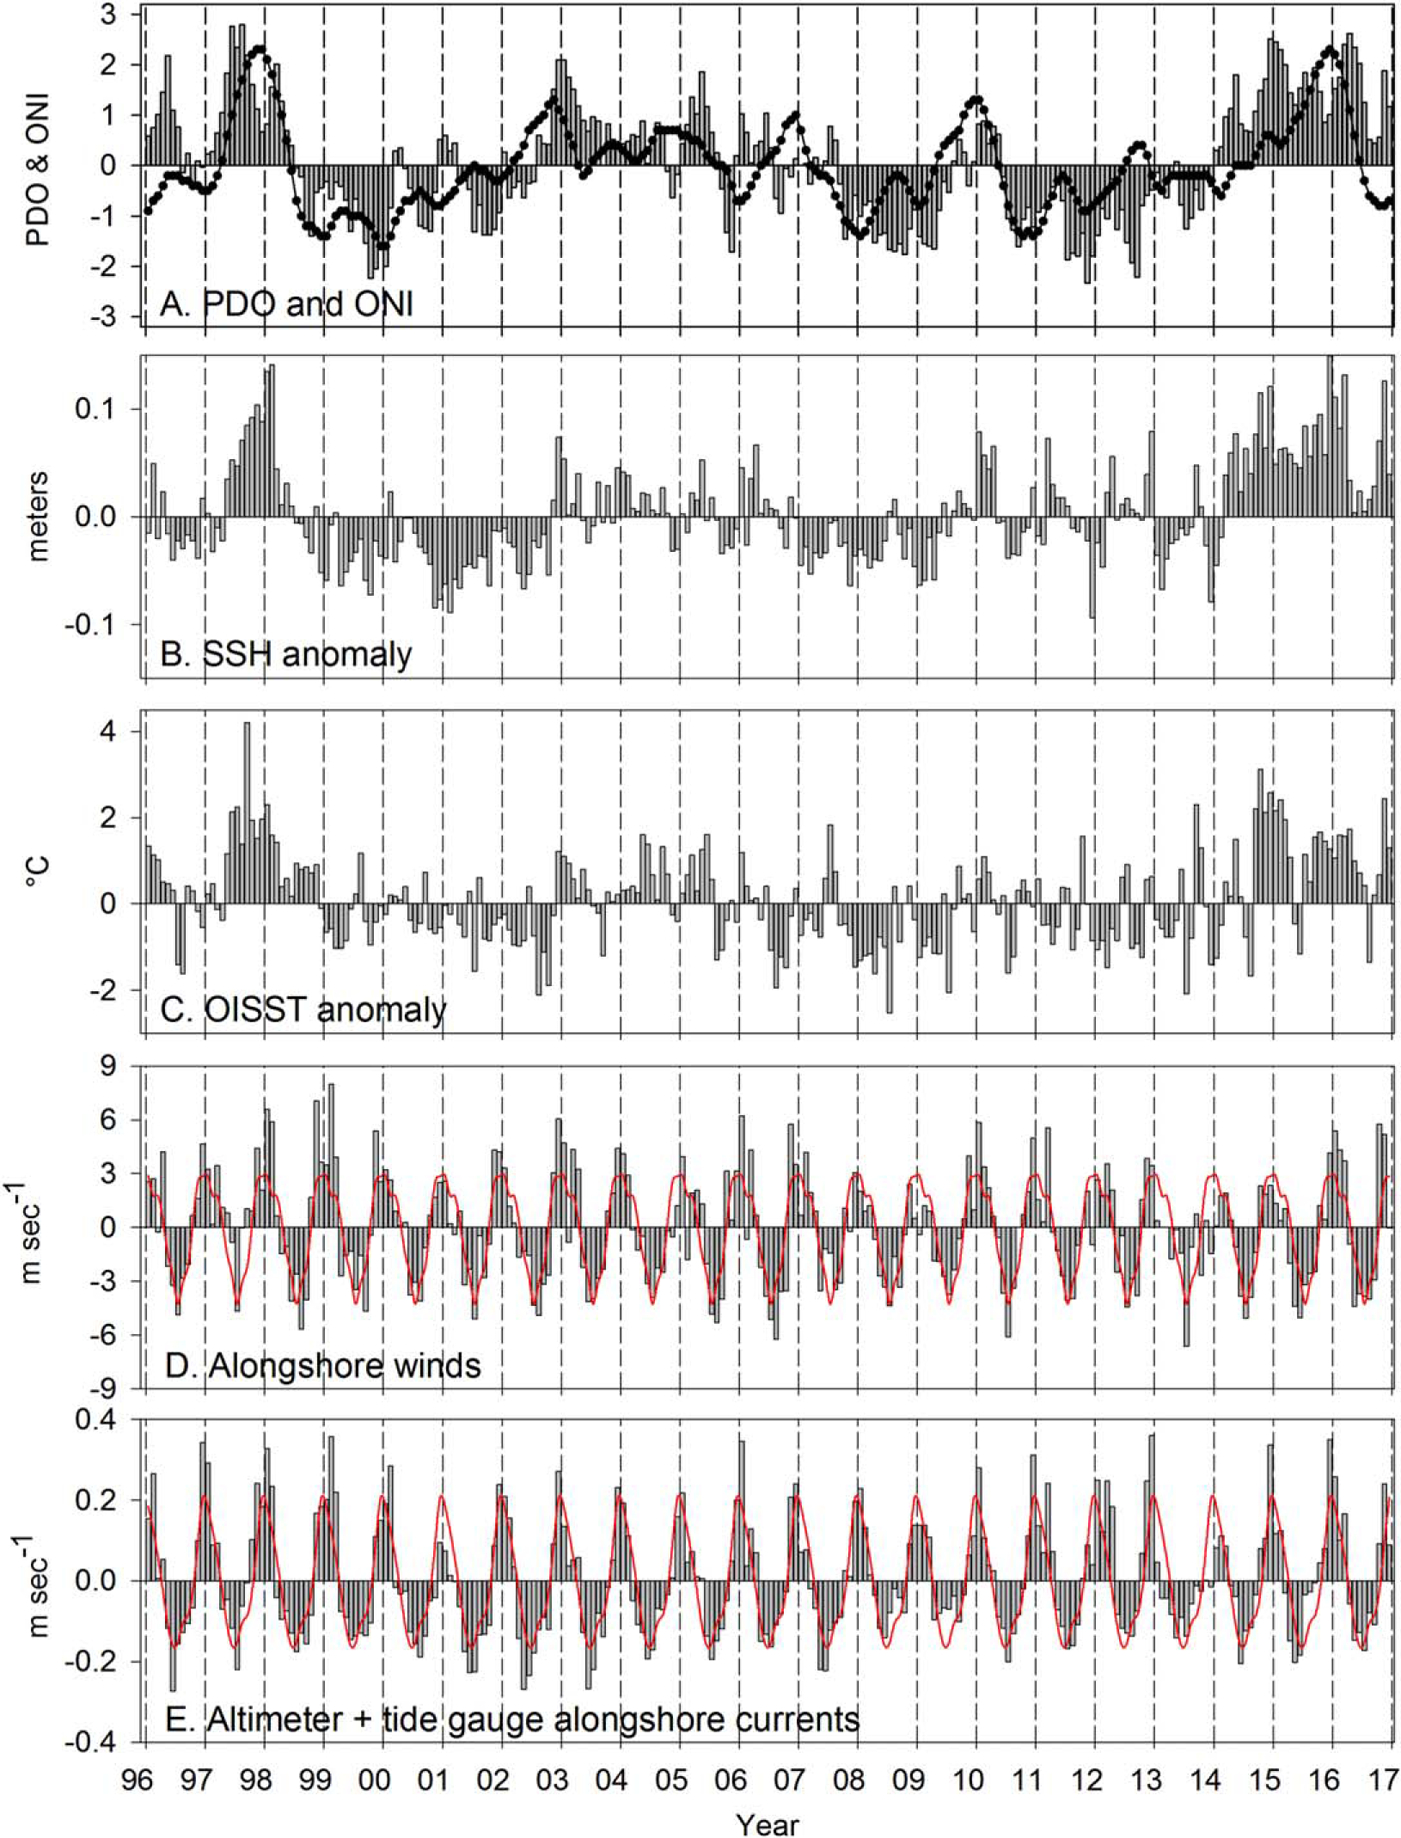
Figure 3.

Pacific Decadal Oscillation (PDO; vertical bars), Oceanic Niño Index (ONI; line), Sea Surface Height (SSH), Optimum Interpolation Sea Surface Temperature (OISST), alongshore winds, and alongshore currents. The red lines in Figures 3d and 3e are the climatology of winds and currents respectively. Positive is poleward negative is equatorward.
