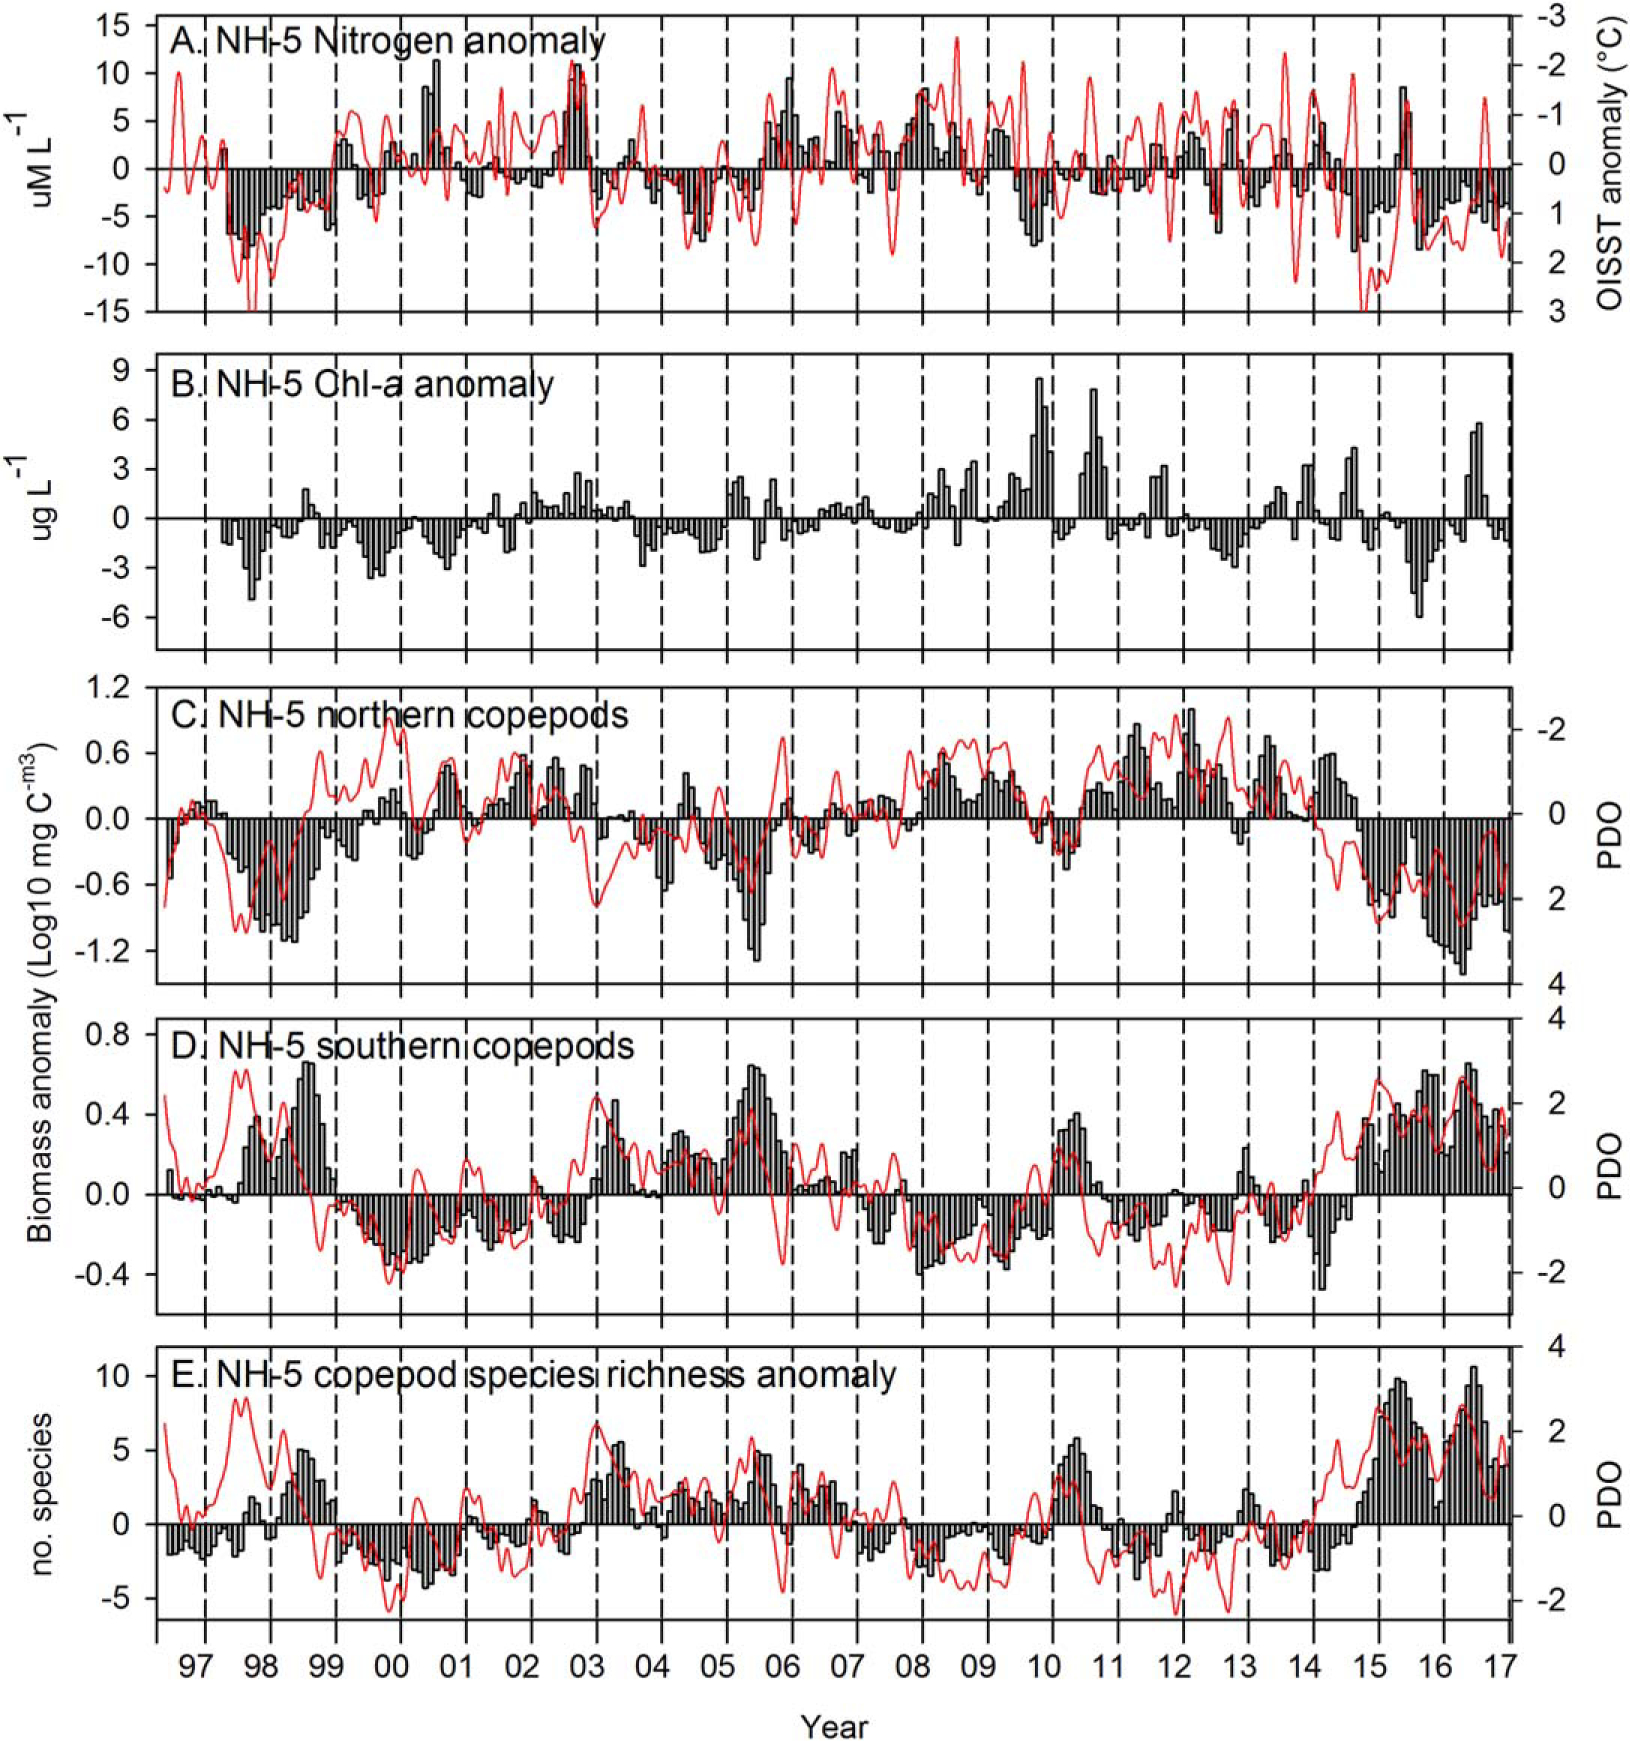
Figure 6.

Nitrogen, chlorophyll-a, northern and southern copepod biomass and copepod species richness (vertical bars) anomalies at station NH-5, with OISST at the station and PDO overlaid as the red lines. All data are smoothed with a 3 month running mean to remove high-frequency variability. Note the reversals of anomaly signs on right axes of Figures 6a and 6c.
