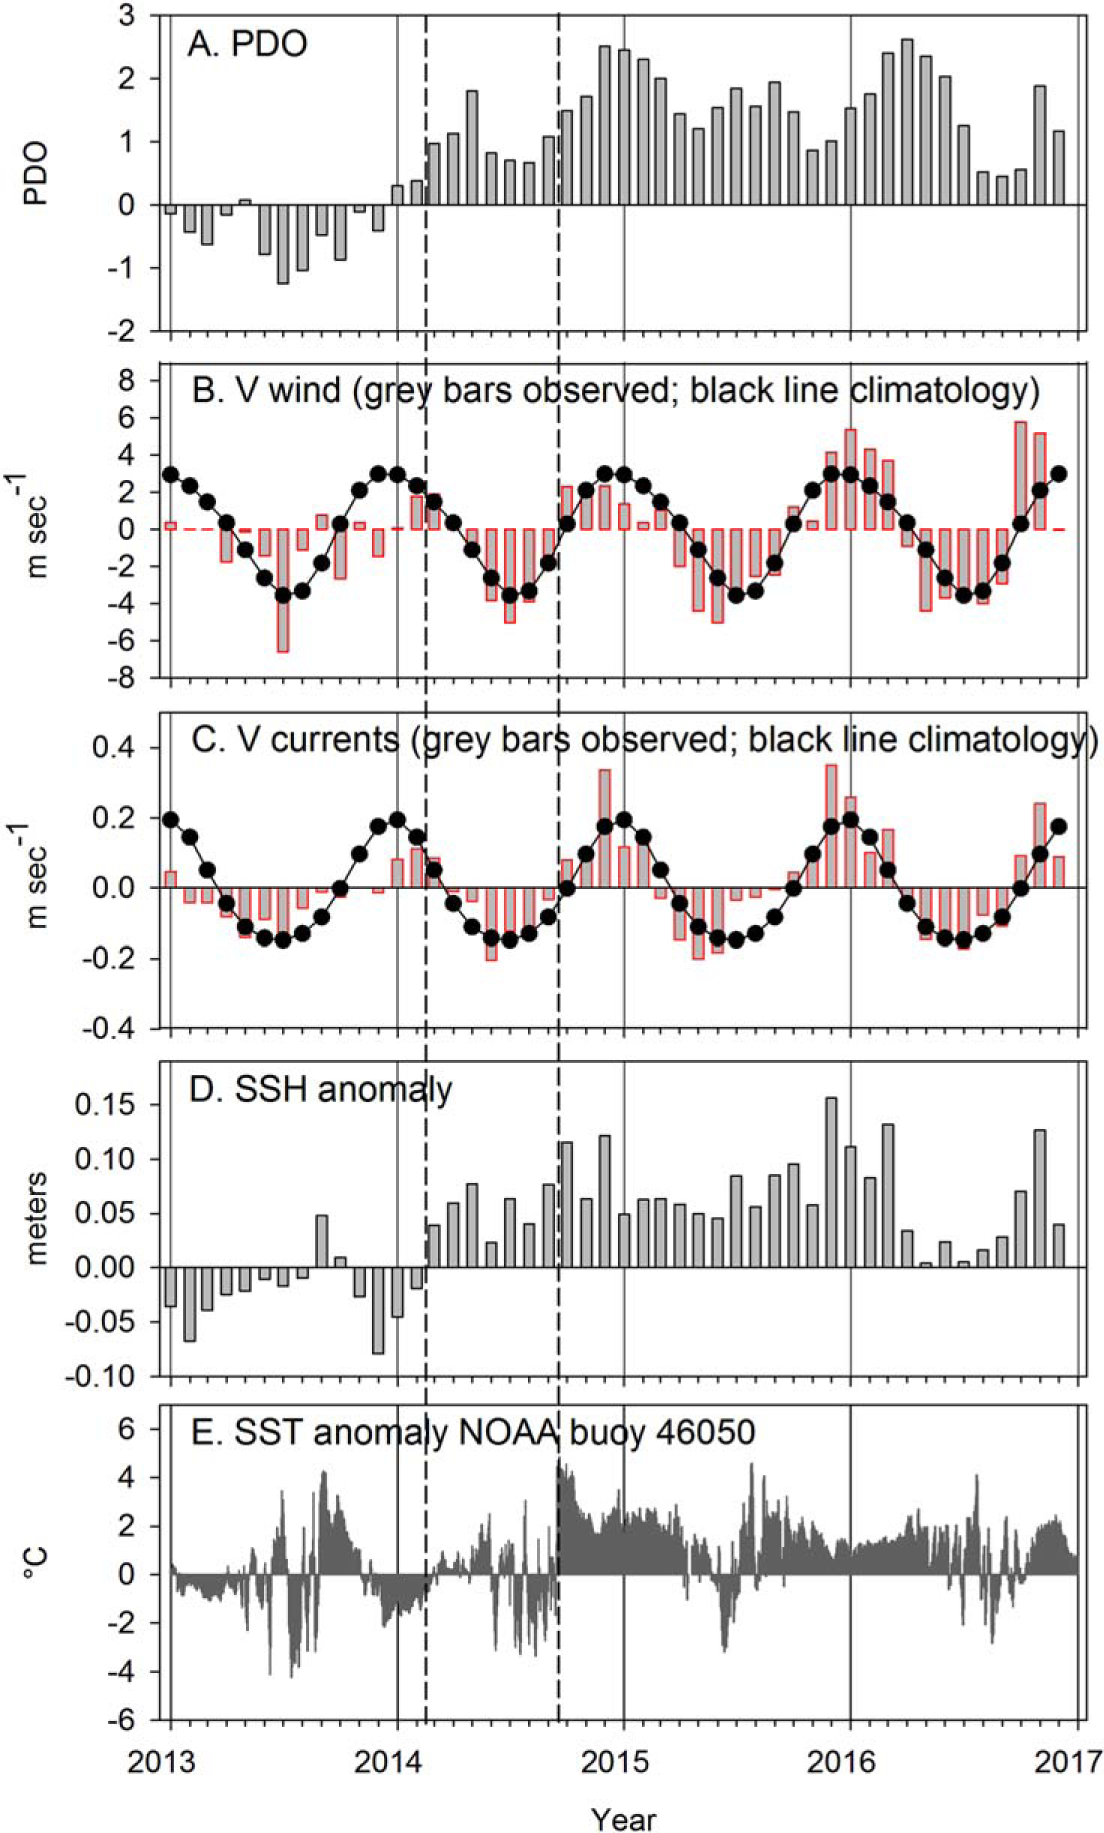
Figure 8.

Monthly values of the PDO, alongshore winds and currents, monthly anomalies of SSH, and daily anomalies of SST from NOAA buoy 46050 from January 2013 through December 2016. The dashed vertical lines indicate (i) when SSH anomalies and the PDO became positive for an extended period (beginning in March 2014), (ii) when the Blob moved into continental shelf waters (mid-September 2014).
