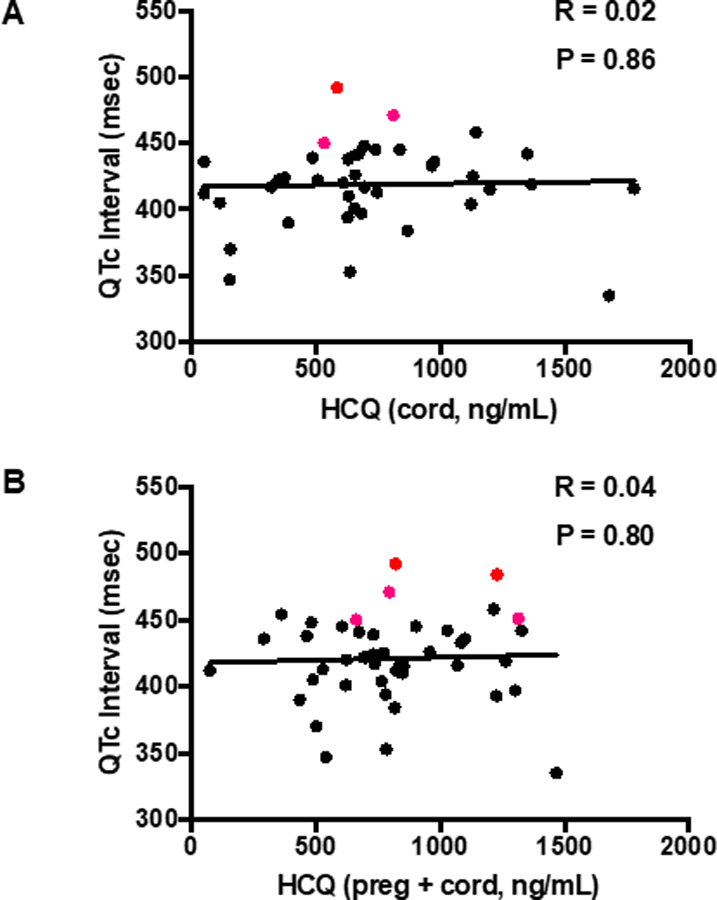
Figure 1. Correlation between blood HCQ levels and neonatal QTc.

(Panel A) Cord HCQ is plotted against QTc. (Panel B) Overall mean HCQ levels (obtained by averaging all HCQ levels throughout an individual pregnancy and cord blood level) are plotted against QTc. Subjects with an abnormally prolonged QTc are designated with red bold circles. All QTc intervals were calculated using the Bazett formula (QTcB).
