
Figure 2.
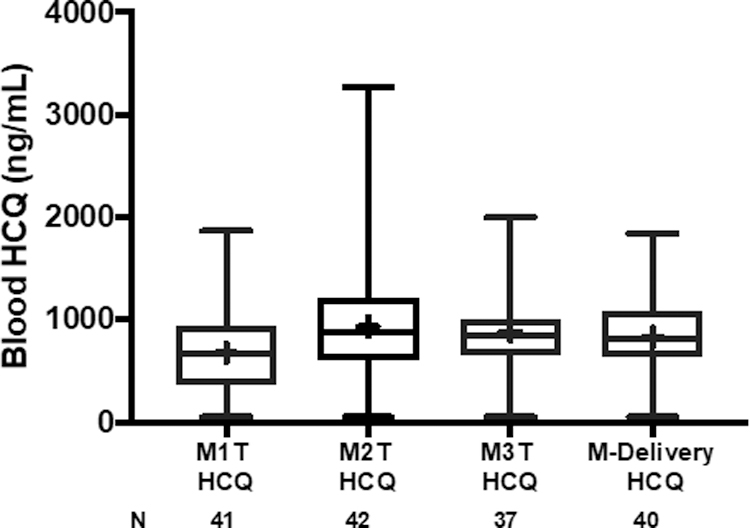
Box plots of maternal blood levels of HCQ during each trimester of pregnancy and delivery. M1T is baseline first trimester. M2T is second trimester. M3T is third trimester. M-Delivery is at the time of delivery. Median levels of HCQ (interquartile range) for M1T: 669 ng/mL (363–941); M2T: 877 ng/mL (604–1212); M3T: 849 ng/mL (652–1000); M-Delivery: 815 ng/mL (645–1080). Mean values denoted by + in box plot.